

Question: Q2. The Update to the Task Force Report on Blood Pressure Control in Children reported the observed average SBP in single years of age from
Q2. The Update to the Task Force Report on Blood Pressure Control in Children reported the observed average SBP in single years of age from age 1 to 17 based on prior studies. The data for boys of average SBP at each age are given below. Suppose we seek a more efficient way to display the data and choose linear regression to accomplish this task.1) Fit a regression line using age as independent variable and SBP as dependent variable. ( appropriate output is required)2) Interpret the regression equation.3) Provide and interpret a 90% confidence interval for the parameters of the regression line.4) Perform ANOVA test for the population slope. Use ? = 0.05, and both rejection region and p-value to make a decision.5) What the estimated blood pressure on average is for a 10-year-old boy as estimated from the regression line?6) Interpret R2.7) Check the conditions for your regression analysis using the appropriate plots.Q3. The correlation coefficient between age and the average SBP in the previous question is 0.993. Does this indicate that there is strong relationship between age and the average SBP? Use ? = 0.05, and either rejection region or p-value to make a decision.
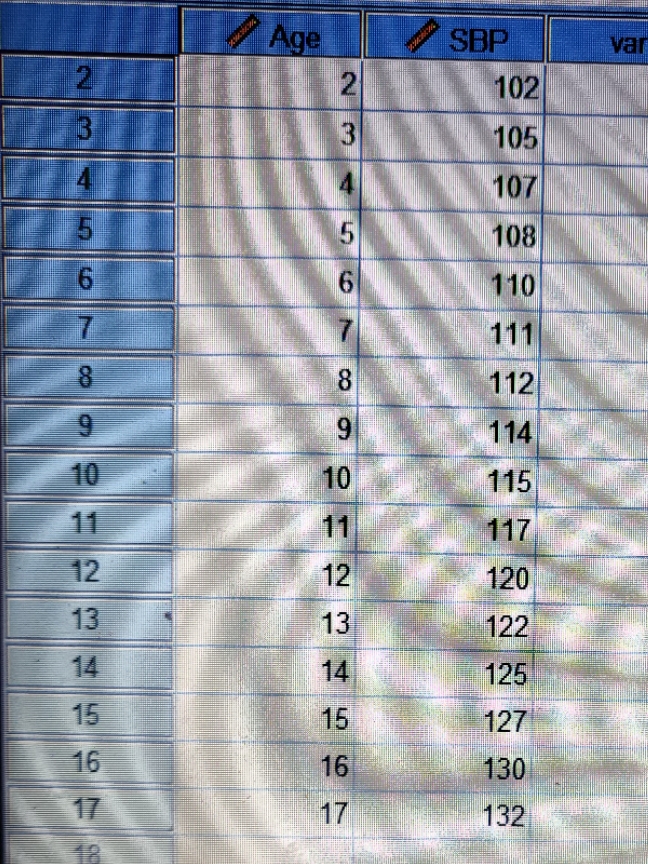
Age SBP var 2 102 3 105 107 108 110 LO CO V OUT A 111 112 114 10 10 115 11 11 117 12 12 120 13 13 122 14 14 125 15 15 127 16 16 130 17 17 132 18
Step by Step Solution
There are 3 Steps involved in it

Get step-by-step solutions from verified subject matter experts