

Question: Q1. The Update to the Task Force Report on Blood Pressure Control in Children reported the observed average SBP in single years of age from
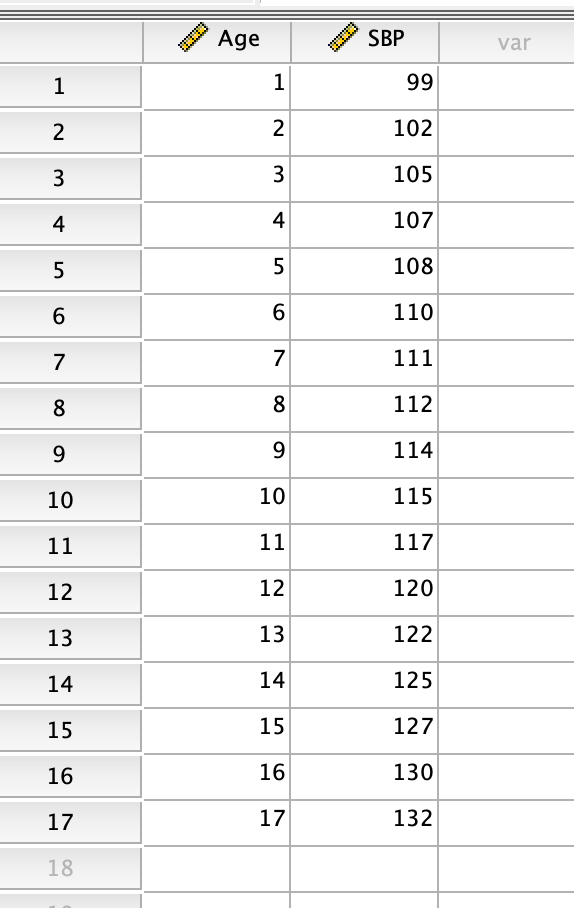
Q1. The Update to the Task Force Report on Blood Pressure Control in Children reported the observed average SBP in single years of age from age 1 to 17 based on prior studies. The data for boys of average SBP at each age are given in the image below. Suppose we seek a more efficient way to display the data and choose linear regression to accomplish this task. Using SPSS
- Fit a regression line using age as independent variable and SBP as dependent variable. (The appropriate output is required here if you used software)
- Interpret the regression equation.
- Provide and interpret a 99% confidence interval for the parameters of the regression line.
- Perform ANOVA test for the population slope. Use ? = 0.01, and bothrejection region and p-value to make a decision.
- What the predicted (estimated) blood pressure on average is for a 7-year-old boy as estimated from the regression line?
- Interpret R2.
- Check the conditions for your regression analysis using the appropriate plots.
Step by Step Solution
There are 3 Steps involved in it
1 Expert Approved Answer
Step: 1 Unlock

Question Has Been Solved by an Expert!
Get step-by-step solutions from verified subject matter experts
Step: 2 Unlock
Step: 3 Unlock