

Question: Q2code.py Code: import numpy as np import math import cvxpy as cp import pandas as pd import seaborn as sns import matplotlib.pyplot as plt import
Q2code.py Code:
import numpy as np
import math
import cvxpy as cp
import pandas as pd
import seaborn as sns
import matplotlib.pyplot as plt
import scipy.cluster.hierarchy as sch,random
import warnings
warnings.filterwarnings('ignore')
plt.style.use('ggplot')
dataset_log_returns = pd.read_csv('dataset.csv', index_col=0, parse_dates=True)
# The function you need to write.
# Input: cov: a dataframe containing the covariance matrix of stocks.
# sortIx: a list containing the stocks names, ordered by the stage 1&2.
# You can add any input argument if you need.
# Output: allocation weight. You can output any data type as long as you can use it properly in Q3.
def getRecBipart(cov,sortIx):
# A sub function for the satge 1 and 2, called in the hrp_s12()
def getQuasiDiag(link):
link=link.astype(int)
sortIx=pd.Series([link[-1,0],link[-1,1]])
numItems=link[-1,3]
while sortIx.max()>=numItems:
sortIx.index=range(0,sortIx.shape[0]*2,2)
df0=sortIx[sortIx>=numItems]
i=df0.index;j=df0.values-numItems
sortIx[i]=link[j,0]
df0=pd.Series(link[j,1],index=i+1)
sortIx=sortIx.append(df0)
sortIx=sortIx.sort_index()
sortIx.index=range(sortIx.shape[0])
return sortIx.tolist()
# Transform the correlation matrix to a distance matrix
def correlDist(corr, n_stock):
dist=((1-corr)/2.)**.5
for i in range(n_stock):
dist.iloc[i,i] = 0
return dist
# Plot the heatmap of the correlation matrix
def plotCorrMatrix(path,corr,labels=None):
#
if labels is None:labels=[]
plt.pcolor(corr)
plt.colorbar()
plt.yticks(np.arange(.5,corr.shape[0]+.5),labels)
plt.xticks(np.arange(.5,corr.shape[0]+.5),labels)
plt.savefig(path)
plt.clf();plt.close()
return
# Function for Stage 1 and 2
def hrp_s12(cov,stock_namelist, ifplot = False):
n_stock = len(stock_namelist)
#1) compute and plot correlation matrix
v = np.diag(np.sqrt(1p.diag(cov)))
corr = np.dot(np.dot(v,cov), v)
cov = pd.DataFrame(cov, columns = stock_namelist, index = stock_namelist)
corr = pd.DataFrame(corr, columns = stock_namelist, index = stock_namelist)
if (ifplot): plotCorrMatrix('HRP_corr0.png',corr,labels=corr.columns)
#2) cluster
dist=correlDist(corr,n_stock)
link=sch.linkage(dist,'single')
sortIx=getQuasiDiag(link)
sortIx=corr.index[sortIx].tolist() # recover labels
df0=corr.loc[sortIx,sortIx] # reorder
if (ifplot): plotCorrMatrix('HRP_corr1.png',df0,labels=df0.columns)
return sortIx
def hrp_s3(cov,stock_namelist,sortIx):
cov = pd.DataFrame(cov, columns = stock_namelist, index = stock_namelist)
# Finish this function getRecBipart(cov,sortIx).
hrp = getRecBipart(cov,sortIx)
# Please print and check the "hrp" returned by the "getRecBipart(cov,sortIx)".
# The order of stocks in "hrp" maybe follow the "sortIx", which is different from the "stock_namelist".
# I suggest you to restore the order of "hrp" to "stock_namelist" here,
# in order to avoid mistakes in Q3.
# My "hrp" is a pandas.series, so this is what I do:
hrp = hrp[stock_namelist]
# It's OK if you want to finish this step in "getRecBipart()".
# It's also Ok if you want to skip this step here and deal with this small order problem in Q3.
return hrp
if __name__ == '__main__':
stock_namelist = dataset_log_returns.columns.values.tolist()
log_returns_1 = dataset_log_returns.loc['2015-01-06':'2015-05-29']
Sigma = np.cov(log_returns_1.T)
# Fill in the right argument to get the plots and new order of stocks:
sortIx = hrp_s12(Sigma, stock_namelist, ifplot= )
# After finish the function of stage 3, call it and print the final weight:
w_hrp = hrp_s3(Sigma, stock_namelist, sortIx)
print(w_hrp)
Reference data (dataset.csv in the code or log-returns in the question):
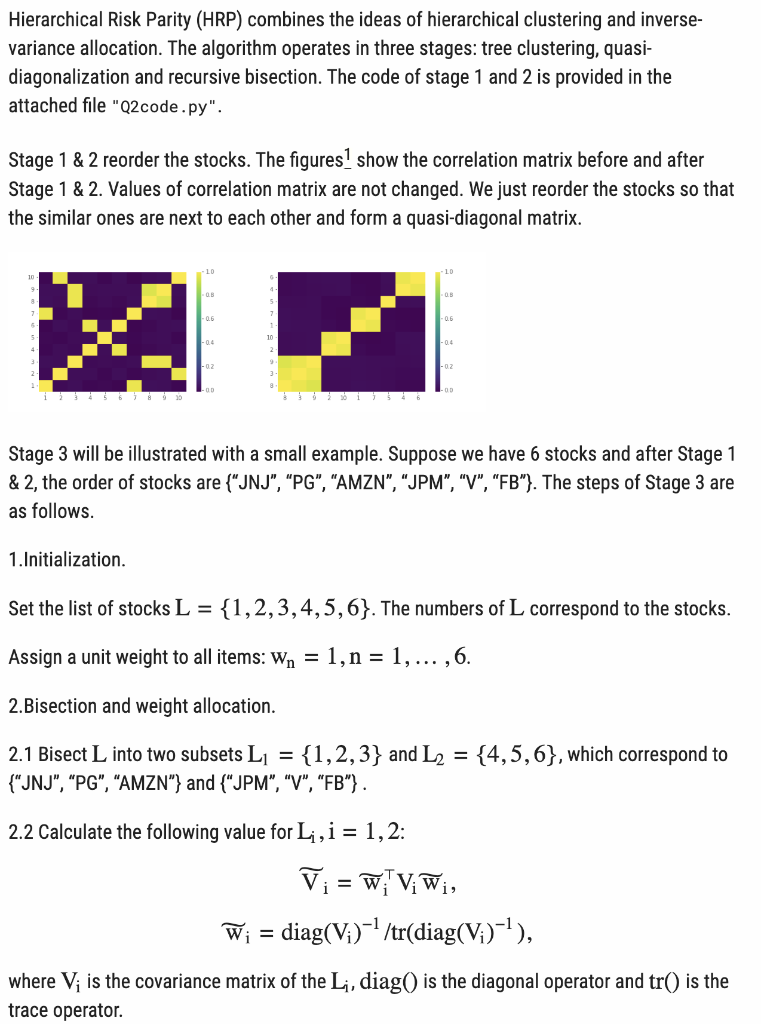
Hierarchical Risk Parity (HRP) combines the ideas of hierarchical clustering and inversevariance allocation. The algorithm operates in three stages: tree clustering, quasidiagonalization and recursive bisection. The code of stage 1 and 2 is provided in the attached file "Q2code.py". Stage 1&2 reorder the stocks. The figures_ 1 show the correlation matrix before and after Stage 1 \& 2. Values of correlation matrix are not changed. We just reorder the stocks so that the similar ones are next to each other and form a quasi-diagonal matrix. Stage 3 will be illustrated with a small example. Suppose we have 6 stocks and after Stage 1 \& 2, the order of stocks are { "JNJ", "PG", "AMZN", "JPM", "V", "FB"\}. The steps of Stage 3 are as follows. 1.Initialization. Set the list of stocks L={1,2,3,4,5,6}. The numbers of L correspond to the stocks. Assign a unit weight to all items: wn=1,n=1,,6. 2.Bisection and weight allocation. 2.1 Bisect L into two subsets L1={1,2,3} and L2={4,5,6}, which correspond to \{"JNJ", "PG", "AMZN"\} and \{"JPM", "V", "FB"\} . 2.2 Calculate the following value for Li,i=1,2 : Vi=wiViwi,wi=diag(Vi)1/tr(diag(Vi)1), where Vi is the covariance matrix of the Li,diag() is the diagonal operator and tr() is the trace operator. 2.3 Compute the split factor: =1V1+V2V1. 2.4 Re-scale allocations wn,nL1 by :wn=wn,n=1,2,3. Re-scale allocations wn,nL2 by 1:wn=wn(1),n=4,5,6. 3.Continue the bisection and weight allocation for L1 and L2 until all subsets have only 1 stock. In this example, we get subsets {1} and {2,3} from L1. Then we apply step 2 to {1} and {2,3}, updating the allocations of stock {1} and {2,3}. After this round, {1} has only one stock, so no more bisection can be done. But {2,3} need to be bisected and update the allocations one more time. The same is for L2. (a) Plot the correlation matrix before and after the stage 1&2 with the code provided. (Use the function "hrp_s12()".) Please read the notes in the attached code file carefully. The "hrp_s12() ", "hrp_s3()" and "getRecBipart () " are three functions you need to focus. You do not need to read the code of other functions in detail. (b) Finish the code for Stage 3 (the function "getRecBipart()"). Please read the notes in the attached code file carefully. (c) Print the final weight for log-returns from "2015-01-06" to "2015-05-29" . Hierarchical Risk Parity (HRP) combines the ideas of hierarchical clustering and inversevariance allocation. The algorithm operates in three stages: tree clustering, quasidiagonalization and recursive bisection. The code of stage 1 and 2 is provided in the attached file "Q2code.py". Stage 1&2 reorder the stocks. The figures_ 1 show the correlation matrix before and after Stage 1 \& 2. Values of correlation matrix are not changed. We just reorder the stocks so that the similar ones are next to each other and form a quasi-diagonal matrix. Stage 3 will be illustrated with a small example. Suppose we have 6 stocks and after Stage 1 \& 2, the order of stocks are { "JNJ", "PG", "AMZN", "JPM", "V", "FB"\}. The steps of Stage 3 are as follows. 1.Initialization. Set the list of stocks L={1,2,3,4,5,6}. The numbers of L correspond to the stocks. Assign a unit weight to all items: wn=1,n=1,,6. 2.Bisection and weight allocation. 2.1 Bisect L into two subsets L1={1,2,3} and L2={4,5,6}, which correspond to \{"JNJ", "PG", "AMZN"\} and \{"JPM", "V", "FB"\} . 2.2 Calculate the following value for Li,i=1,2 : Vi=wiViwi,wi=diag(Vi)1/tr(diag(Vi)1), where Vi is the covariance matrix of the Li,diag() is the diagonal operator and tr() is the trace operator. 2.3 Compute the split factor: =1V1+V2V1. 2.4 Re-scale allocations wn,nL1 by :wn=wn,n=1,2,3. Re-scale allocations wn,nL2 by 1:wn=wn(1),n=4,5,6. 3.Continue the bisection and weight allocation for L1 and L2 until all subsets have only 1 stock. In this example, we get subsets {1} and {2,3} from L1. Then we apply step 2 to {1} and {2,3}, updating the allocations of stock {1} and {2,3}. After this round, {1} has only one stock, so no more bisection can be done. But {2,3} need to be bisected and update the allocations one more time. The same is for L2. (a) Plot the correlation matrix before and after the stage 1&2 with the code provided. (Use the function "hrp_s12()".) Please read the notes in the attached code file carefully. The "hrp_s12() ", "hrp_s3()" and "getRecBipart () " are three functions you need to focus. You do not need to read the code of other functions in detail. (b) Finish the code for Stage 3 (the function "getRecBipart()"). Please read the notes in the attached code file carefully. (c) Print the final weight for log-returns from "2015-01-06" to "2015-05-29
Step by Step Solution
There are 3 Steps involved in it

Get step-by-step solutions from verified subject matter experts