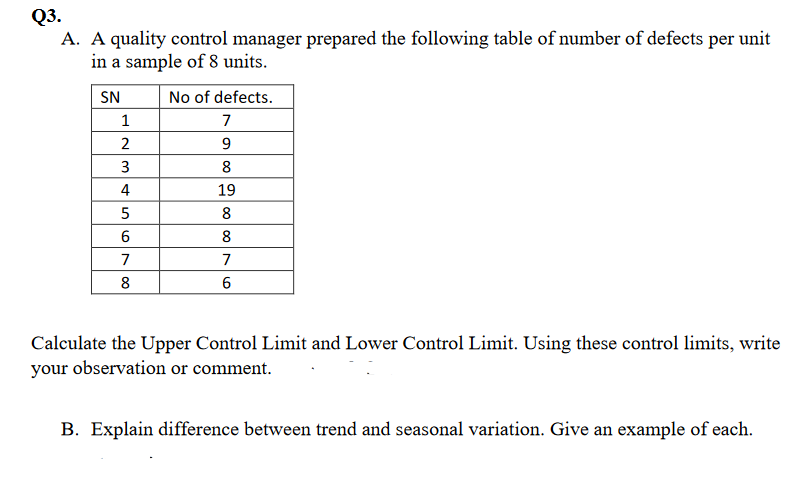
Question: Q3. A. A quality control manager prepared the following table of number of defects per unit in a sample of 8 units. SN No of

Q3. A. A quality control manager prepared the

Q3. A. A quality control manager prepared the following table of number of defects per unit in a sample of 8 units. SN No of defects. 1 7 2 9 3 4 19 5 6 7 7 8 6 8 8 8 Calculate the Upper Control Limit and Lower Control Limit. Using these control limits, write your observation or comment. B. Explain difference between trend and seasonal variation. Give an example of each

Step by Step Solution

There are 3 Steps involved in it

1 Expert Approved Answer
Step: 1 Unlock blur-text-image
Question Has Been Solved by an Expert!

Get step-by-step solutions from verified subject matter experts

Step: 2 Unlock
Step: 3 Unlock

Students Have Also Explored These Related General Management Questions!