

Question: Q7. (2 marks) Below is a graph showing the change in a neuron membrane potential as it moves from the resting potential to an action
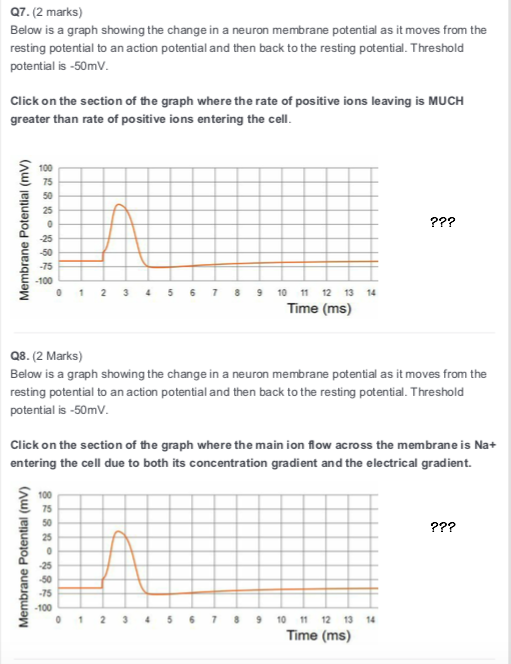
Q7. (2 marks) Below is a graph showing the change in a neuron membrane potential as it moves from the resting potential to an action potential and then back to the resting potential. Threshold potential is -50mV. Click on the section of the graph where the rate of positive ions leaving is MUCH greater than rate of positive ions entering the cell. ??? Membrane Potential (mV) 9 10 11 12 13 14 Time (ms) Q8. (2 Marks) Below is a graph showing the change in a neuron membrane potential as it moves from the resting potential to an action potential and then back to the resting potential. Threshold potential is -50mV. Click on the section of the graph where the main ion flow across the membrane is Na+ entering the cell due to both its concentration gradient and the electrical gradient. 100 ??? Membrane Potential (mV) 1 2 3 4 5 6 7 8 9 10 11 12 13 14 Time (ms)
Step by Step Solution
There are 3 Steps involved in it

Get step-by-step solutions from verified subject matter experts