

Question: q8&9 E6-30A. Regression analysis using Excel output (Learning Objective Assume that Broadway Floral does a regression analysis on the next year's data using Excel. The
q8&9 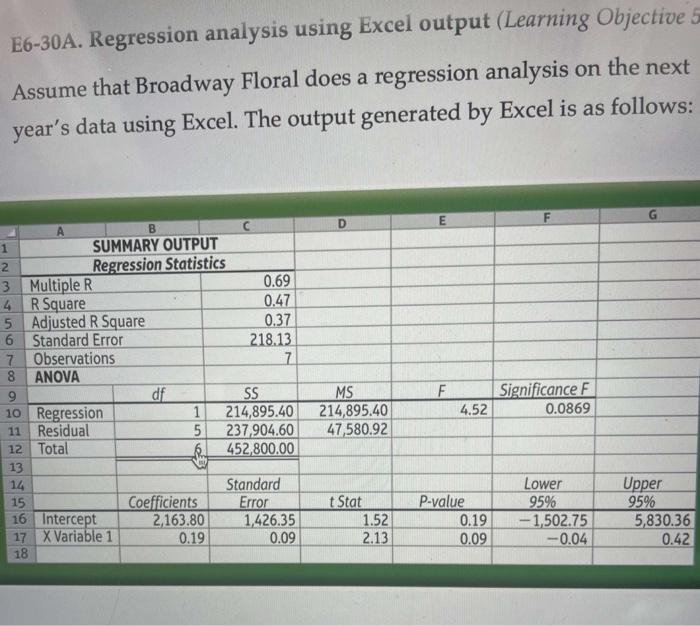
E6-30A. Regression analysis using Excel output (Learning Objective Assume that Broadway Floral does a regression analysis on the next year's data using Excel. The output generated by Excel is as follows: Compared to the high-low method, regression analysis considers every data point, not just the high- and low-volume data points, when forming the best fitting line. True False The highest value an R-Square can be is .90 or 90% in any type of regression problem. True False
Step by Step Solution
There are 3 Steps involved in it
1 Expert Approved Answer
Step: 1 Unlock

Question Has Been Solved by an Expert!
Get step-by-step solutions from verified subject matter experts
Step: 2 Unlock
Step: 3 Unlock