

Question: QI Create a MATLAB Script File to plot Cayley's Sectic on the xy plane over the parametric interval -2n Sts 2n, where a = 3:
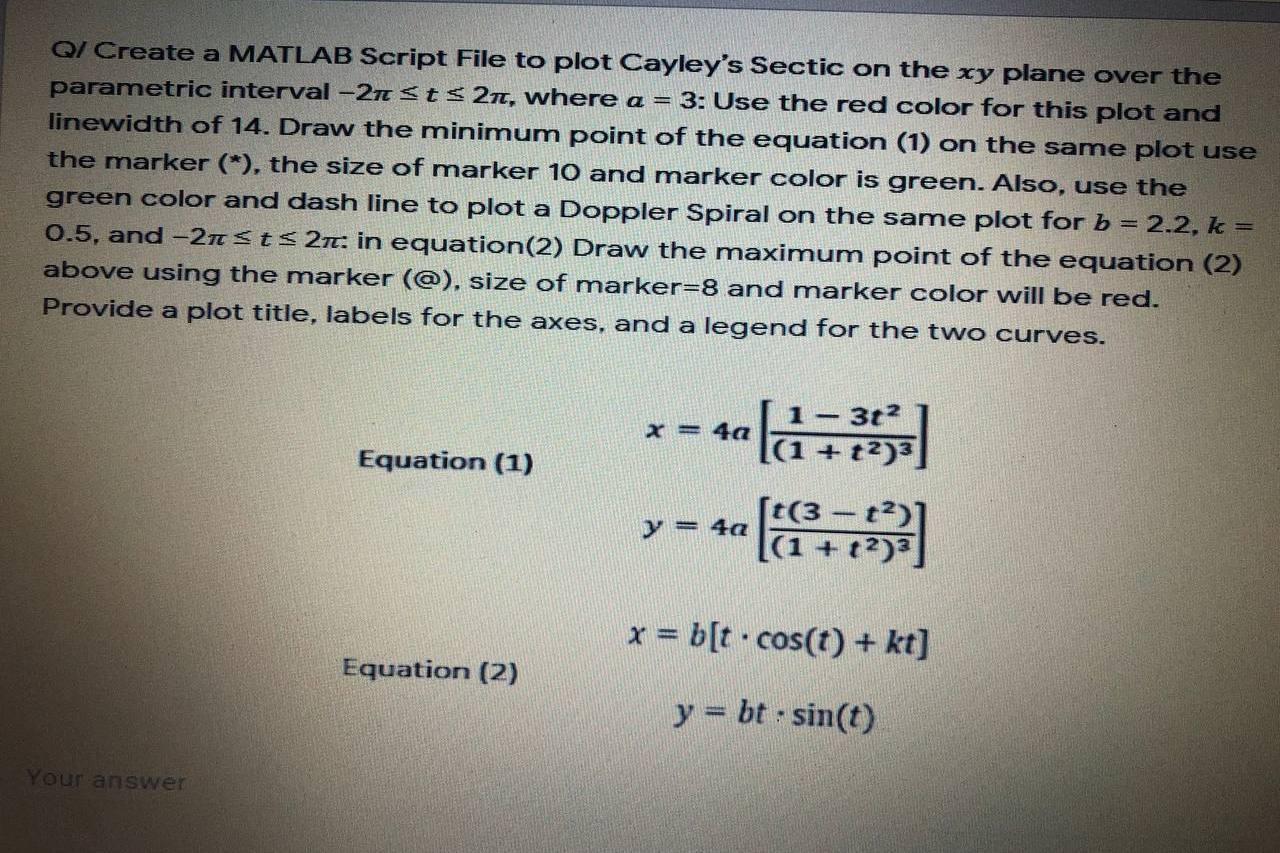
QI Create a MATLAB Script File to plot Cayley's Sectic on the xy plane over the parametric interval -2n Sts 2n, where a = 3: Use the red color for this plot and linewidth of 14. Draw the minimum point of the equation (1) on the same plot use the marker (*), the size of marker 10 and marker color is green. Also, use the green color and dash line to plot a Doppler Spiral on the same plot for b = 2.2, k = 0.5, and -2n Sts 21. in equation(2) Draw the maximum point of the equation (2) above using the marker (@), size of marker=8 and marker color will be red. Provide a plot title, labels for the axes, and a legend for the two curves. 1 - 302 x = 4a |(1 + {2)) 4 Equation (1) [t(3-t2 = 42 ((1 + 72)3 13] - x = b[t.cos(t) + kt] Equation (2) y = bt : sin(t) Your
Step by Step Solution
There are 3 Steps involved in it

Get step-by-step solutions from verified subject matter experts