

Question: Qu. 1 The data presented in Table 1 below show the price and quantity data collected for four (4) selected indicator items of a
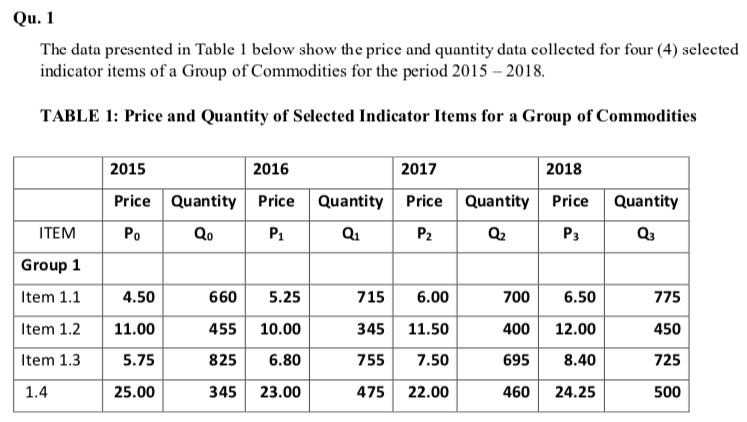
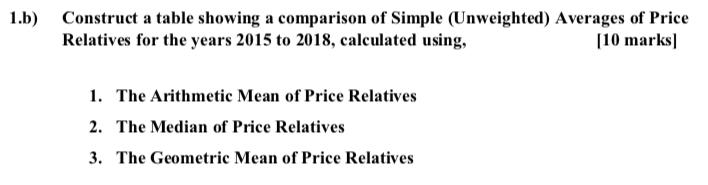
Qu. 1 The data presented in Table 1 below show the price and quantity data collected for four (4) selected indicator items of a Group of Commodities for the period 2015 2018. TABLE 1: Price and Quantity of Selected Indicator Items for a Group of Commodities 2015 2016 2017 2018 Price Quantity Price Quantity Price Quantity Price Quantity ITEM Po Qo P1 Q1 P2 Q2 P3 Q3 Group 1 Item 1.1 4.50 660 5.25 715 6.00 700 6.50 775 Item 1.2 11.00 455 10.00 345 11.50 400 12.00 450 Item 1.3 5.75 825 6.80 755 7.50 695 8.40 725 1.4 25.00 345 23.00 475 22.00 460 24.25 500 1.b) Construct a table showing a comparison of Simple (Unweighted) Averages of Price [10 marks] Relatives for the years 2015 to 2018, calculated using, 1. The Arithmetic Mean of Price Relatives 2. The Median of Price Relatives 3. The Geometric Mean of Price Relatives
Step by Step Solution
3.36 Rating (149 Votes )
There are 3 Steps involved in it
b Table for Simple unweighted averages of Price relatives Year 2015 2016 2017 2018 Arithmetic mean ... View full answer

Get step-by-step solutions from verified subject matter experts
Document Format (2 attachments)
609a110b79a93_210915.pdf
180 KBs PDF File
609a110b79a93_210915.docx
120 KBs Word File