

Question: QUALITY MANAGEMENT Consider the above past data from a production line (m=10). Fill in the blank cells (in grey color) by assigning any two digit
QUALITY MANAGEMENT 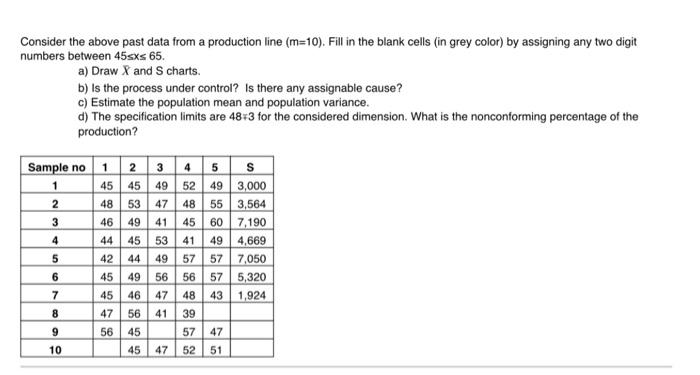
Consider the above past data from a production line (m=10). Fill in the blank cells (in grey color) by assigning any two digit numbers between 45sxs 65. a) Draw X and S charts b) Is the process under control? Is there any assignable cause? c) Estimate the population mean and population variance. d) The specification limits are 48+3 for the considered dimension. What is the nonconforming percentage of the production? Sample no 1 2 3 4 5 S 1 45 45 49 52 49 3,000 2 48 53 47 48 55 3,564 3 46 49 41 45 607,190 4 44 45 53 41 494,669 5 42 57 577,050 6 45 49 56 56 57 5,320 7 45 46 47 48 43 1,924 8 47 5641 39 9 56 45 5747 10 45 47 52 51 - 44 49
Step by Step Solution
There are 3 Steps involved in it
1 Expert Approved Answer
Step: 1 Unlock

Question Has Been Solved by an Expert!
Get step-by-step solutions from verified subject matter experts
Step: 2 Unlock
Step: 3 Unlock