

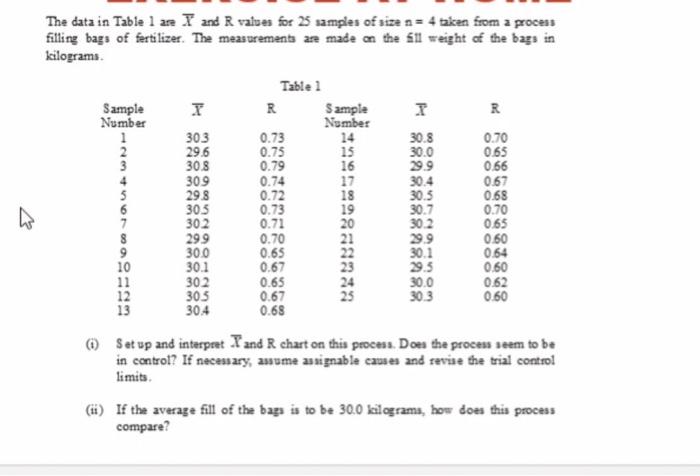
Question: Quality Management please step by step and with control chart (graph) The data in Table 1 are 7 and R vaives for 25 samples of
Quality Management
please step by step and
with control chart (graph)
Step by Step Solution
There are 3 Steps involved in it
1 Expert Approved Answer
Step: 1 Unlock

Question Has Been Solved by an Expert!
Get step-by-step solutions from verified subject matter experts
Step: 2 Unlock
Step: 3 Unlock