

Question: QUALITY MANAGEMENT Task : 1.Rank order your data in an analysis sheet (table form) and draw a Pareto Chart. 2.From the pareto, where should you
QUALITY MANAGEMENT
Task :
1.Rank order your data in an analysis sheet (table form) and draw a Pareto Chart.
2.From the pareto, where should you concentrate your efforts?
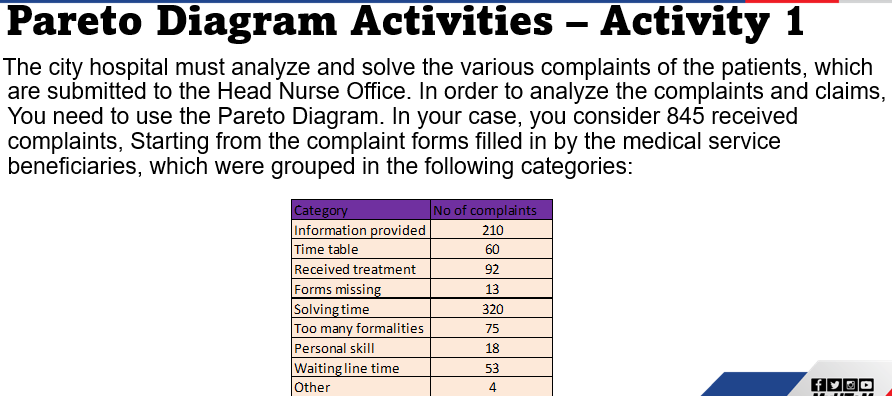
Pareto Diagram Activities - Activity 1 - The city hospital must analyze and solve the various complaints of the patients, which are submitted to the Head Nurse Office. In order to analyze the complaints and claims, You need to use the Pareto Diagram. In your case, you consider 845 received complaints, Starting from the complaint forms filled in by the medical service beneficiaries, which were grouped in the following categories: Category No of complaints Information provided 210 Time table 60 Received treatment 92 Forms missing 13 Solving time 320 Too many formalities 75 Personal skill 18 Waiting line time 53 Other 4 FOODStep by Step Solution
There are 3 Steps involved in it
1 Expert Approved Answer
Step: 1 Unlock

Question Has Been Solved by an Expert!
Get step-by-step solutions from verified subject matter experts
Step: 2 Unlock
Step: 3 Unlock