

Question: Question 1 ( 1 0 x 1 . 5 Marks ) A - Identify each of the measurements shown in figure 1 B - Draw
Question x Marks
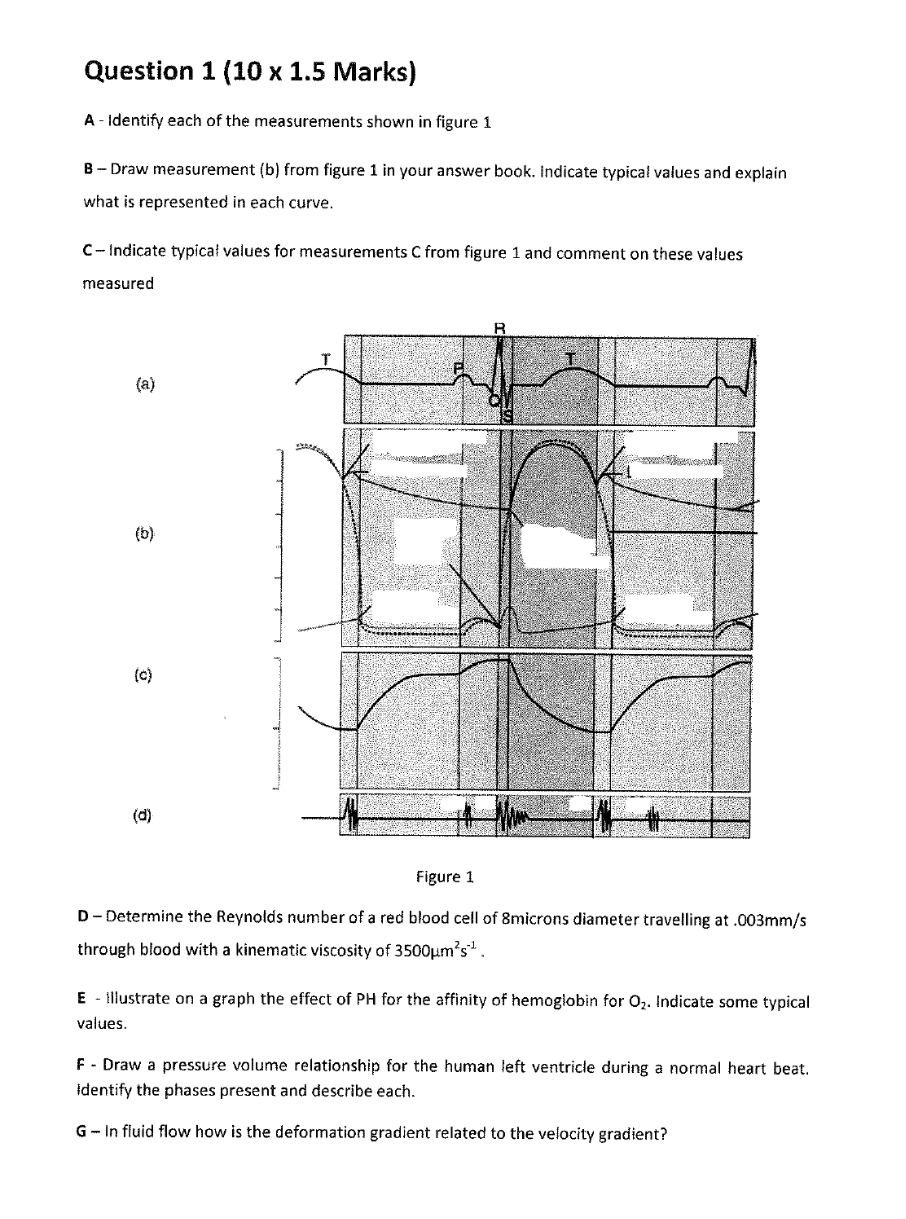
A Identify each of the measurements shown in figure
B Draw measurement b from figure in your answer book. Indicate typical values and explain what is represented in each curve.
CIndicate typical values for measurements from figure and comment on these values measured
D Determine the Reynolds number of a red blood cell of microns diameter travelling at through blood with a kinematic viscosity of
E Illustrate on a graph the effect of PH for the affinity of hemoglobin for Indicate some typical values.
F Draw a pressure volume relationship for the human left ventricle during a normal heart beat. Identify the phases present and describe each.
G In fluid flow how is the deformation gradient related to the velocity gradient?
Step by Step Solution
There are 3 Steps involved in it
1 Expert Approved Answer
Step: 1 Unlock

Question Has Been Solved by an Expert!
Get step-by-step solutions from verified subject matter experts
Step: 2 Unlock
Step: 3 Unlock