

Question: Question 1 (1 point) A student decides to take a survey for her class project. She randomly surveys other students and records their Ranking user
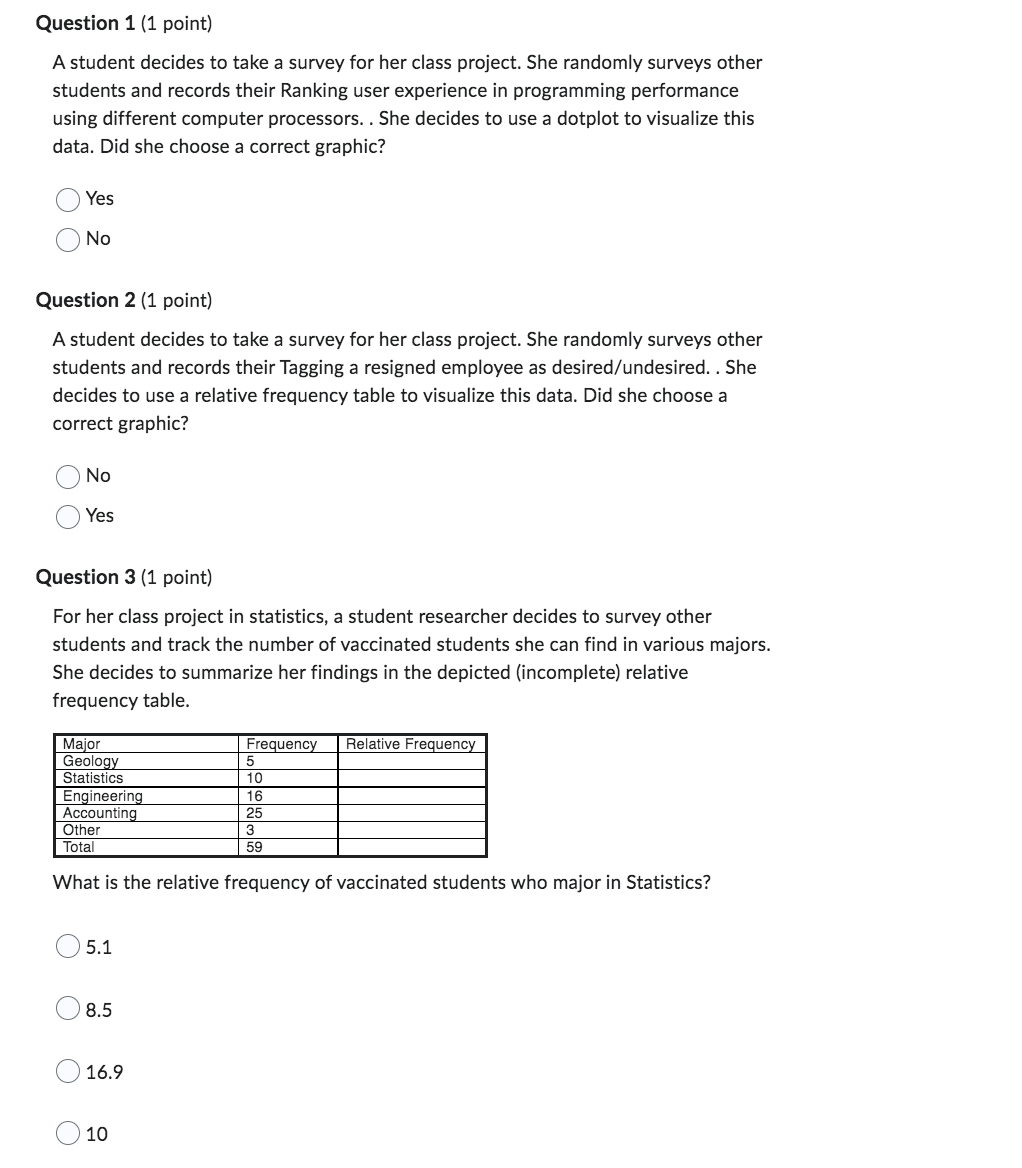
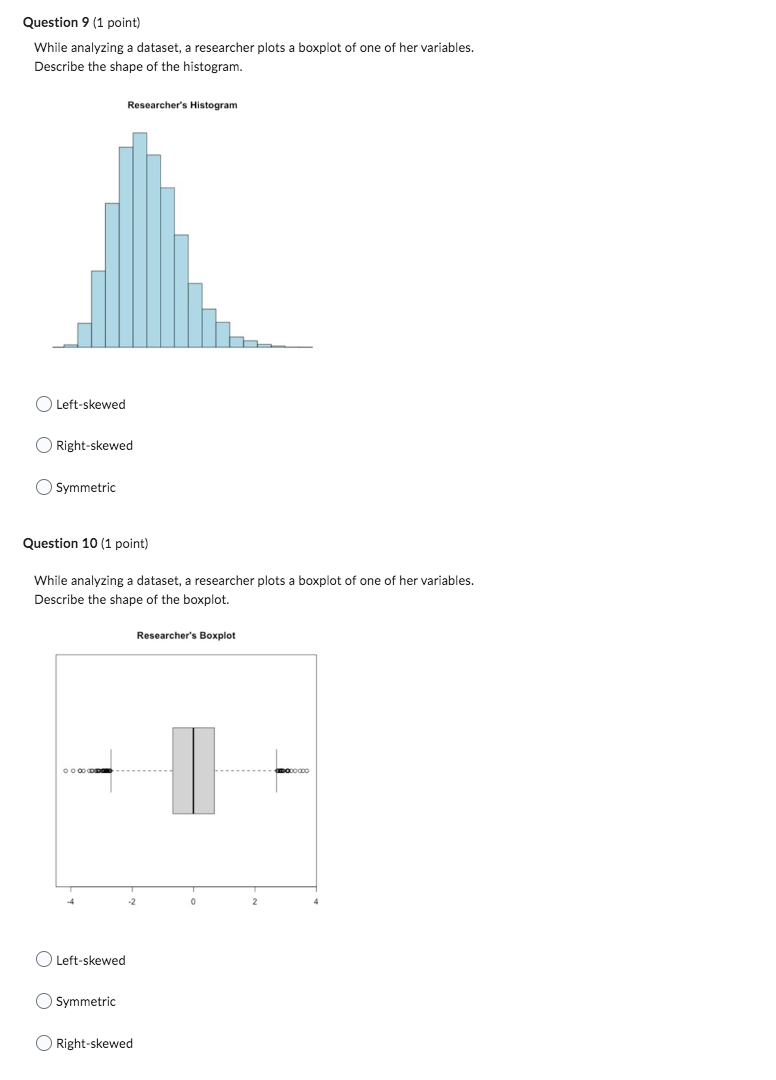
Question 1 (1 point) A student decides to take a survey for her class project. She randomly surveys other students and records their Ranking user experience in programming performance using different computer processors. . She decides to use a dotplot to visualize this data. Did she choose a correct graphic? Yes No Question 2 (1 point) A student decides to take a survey for her class project. She randomly surveys other students and records their Tagging a resigned employee as desired/undesired. . She decides to use a relative frequency table to visualize this data. Did she choose a correct graphic? O No Yes Question 3 (1 point) For her class project in statistics, a student researcher decides to survey other students and track the number of vaccinated students she can find in various majors. She decides to summarize her findings in the depicted (incomplete) relative frequency table. Major Frequency Relative Frequency Geology 5 Statistics 10 Engineering 16 Accounting 25 Other 3 Total 59 What is the relative frequency of vaccinated students who major in Statistics? 5.1 8.5 O 16.9 O 10Question 9 (1 point) While analyzing a dataset, a researcher plots a boxplot of one of her variables. Describe the shape of the histogram. Researcher's Histogram Left-skewed Right-skewed O Symmetric Question 10 (1 point) While analyzing a dataset, a researcher plots a boxplot of one of her variables. Describe the shape of the boxplot. Researcher's Boxplot Left-skewed Symmetric O Right-skewed
Step by Step Solution
There are 3 Steps involved in it

Get step-by-step solutions from verified subject matter experts