

Question: Question 1 1 pts Consider the following boxplots, displaying temperatures recorded at JFK airport in New York City in 2013, separated by month. 100 -
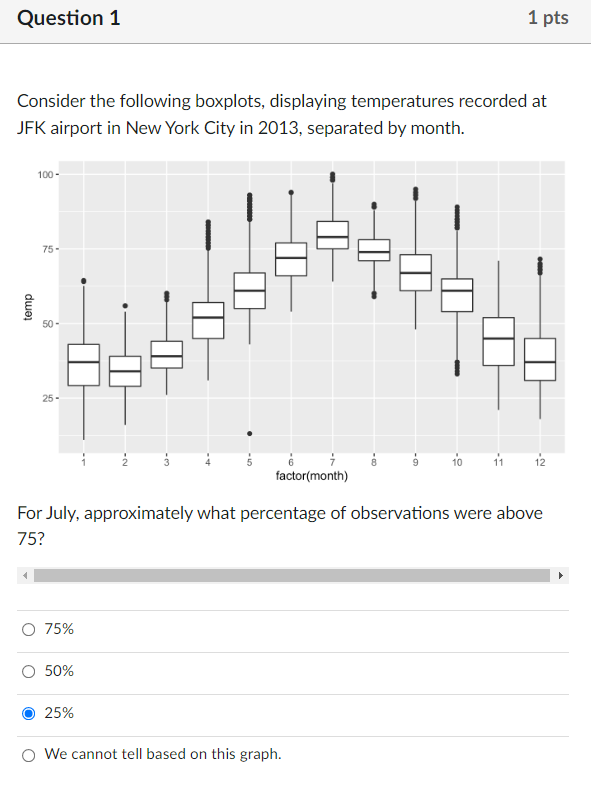
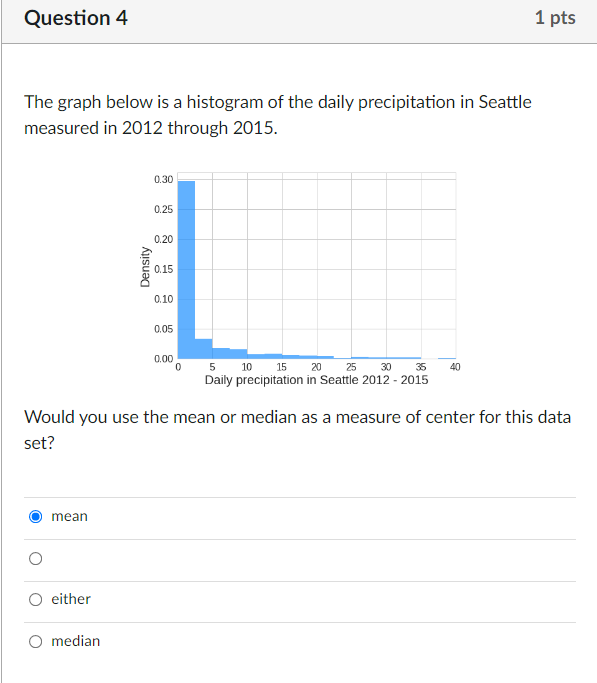


Question 1 1 pts Consider the following boxplots, displaying temperatures recorded at JFK airport in New York City in 2013, separated by month. 100 - 75- temp 50 - 25 - N= 10 11 12 factor(month) For July, approximately what percentage of observations were above 75? O 75% O 50% O 25% O We cannot tell based on this graph.Question 4 1 pts The graph below is a histogram of the daily precipitation in Seattle measured in 2012 through 2015. ll] 15 20 ES 33 :5 40 Daily precipitation in Seattle 21112 - 2D15 Would you use the mean or median as a measure of center for this data set? S mean 0 0 either 0 median
Step by Step Solution
There are 3 Steps involved in it
1 Expert Approved Answer
Step: 1 Unlock

Question Has Been Solved by an Expert!
Get step-by-step solutions from verified subject matter experts
Step: 2 Unlock
Step: 3 Unlock