

Question: Question 1 1 pts Estimate the indicated probability. The table shows the number of college students who prefer a given pizza topping. toppings freshman
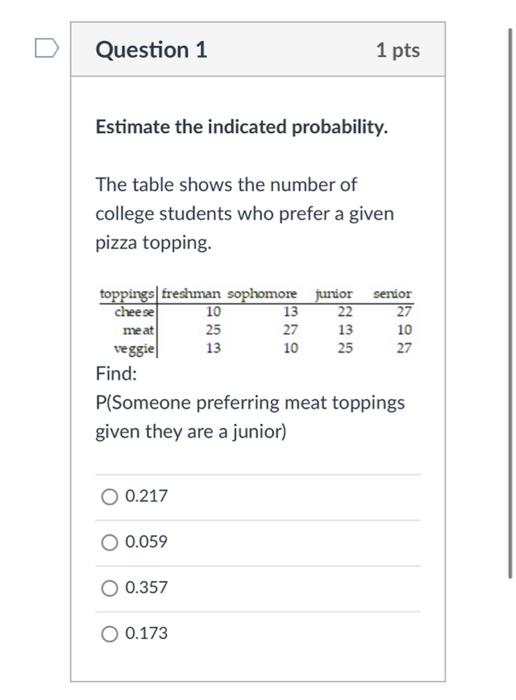
Question 1 1 pts Estimate the indicated probability. The table shows the number of college students who prefer a given pizza topping. toppings freshman sophomore junior senior cheese 10 13 me at 25 27 veggie 13 429 10 222 22 13 25 222 27 10 27 Find: P(Someone preferring meat toppings given they are a junior) 0.217 0.059 0.357 0.173
Step by Step Solution
There are 3 Steps involved in it
1 Expert Approved Answer
Step: 1 Unlock

Question Has Been Solved by an Expert!
Get step-by-step solutions from verified subject matter experts
Step: 2 Unlock
Step: 3 Unlock