

Question: Question 1: (10 marks) For the circuit shown in Fig. 1 below, use Matlab and Mesh analysis to: a) plot the power consumed by the
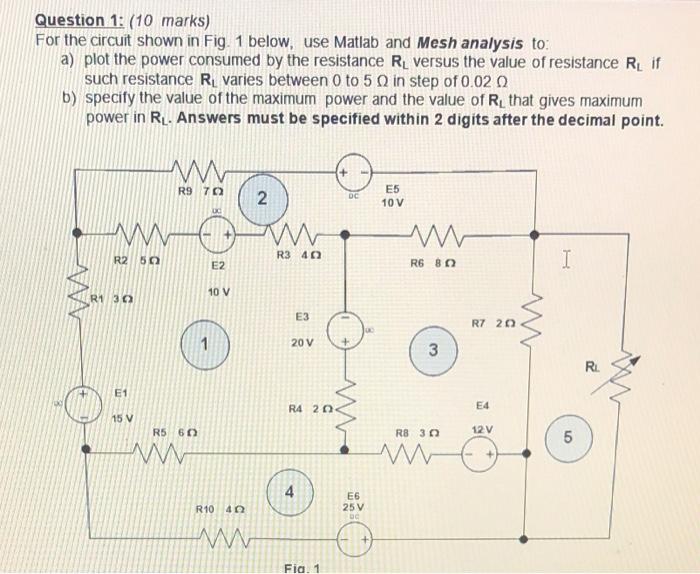
Question 1: (10 marks) For the circuit shown in Fig. 1 below, use Matlab and Mesh analysis to: a) plot the power consumed by the resistance R. versus the value of resistance R if such resistance R varies between 0 to 5 Q in step of 0.02 b) specify the value of the maximum power and the value of R that gives maximum power in RL. Answers must be specified within 2 digits after the decimal point. W R9 70 2 DC E5 10 V ud WW M W R2 50 R3 40 E2 R6 80 I R130 10 V E3 R7 20 20V 3 R E1 R4 20 E4 15 V R5 60 R8 30 12V 5 WW M. + 4 R10 40 E6 25 V DC W Fia. 1
Step by Step Solution
There are 3 Steps involved in it
1 Expert Approved Answer
Step: 1 Unlock

Question Has Been Solved by an Expert!
Get step-by-step solutions from verified subject matter experts
Step: 2 Unlock
Step: 3 Unlock