

Question: For the circuit shown in Fig. 1 below, use Matlab and Mesh analysis to: a) plot the power consumed by the resistance R versus
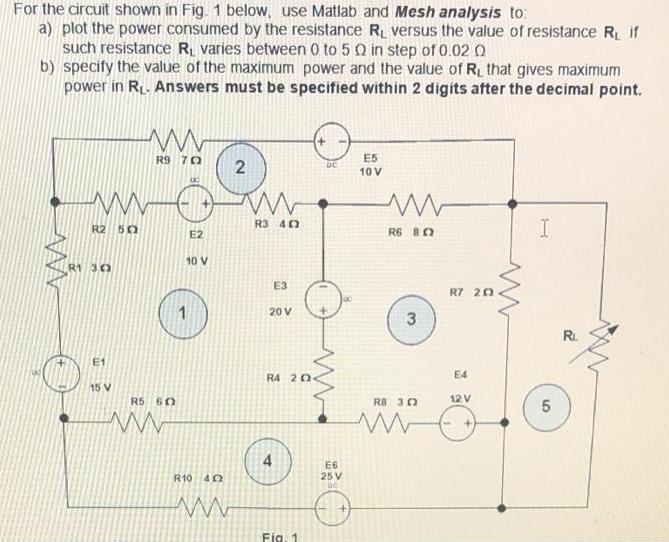
For the circuit shown in Fig. 1 below, use Matlab and Mesh analysis to: a) plot the power consumed by the resistance R versus the value of resistance RL if such resistance RL varies between 0 to 5 02 in step of 0.02 0 b) specify the value of the maximum power and the value of R, that gives maximum power in R. Answers must be specified within 2 digits after the decimal point. -~~- R2 50 R1 30 E1 www R9 70 15 V R5 60 E2 10 V R10 402 www 2 www R3 40 E3 20 V R4 20 Fig. 1 DC UC E6 25 V E5 10 V R6 80 3 RB 30 ww R7 20 E4 12 V I 5 R
Step by Step Solution
There are 3 Steps involved in it
Answer Code clc define the currents in each loop and RL symsI1 I2 I3 I4 I5 RL Circuit Elements are R... View full answer

Get step-by-step solutions from verified subject matter experts