

Question: Question 1 1.1 Complete the table by converting Gross Amounts into Net and vice-versa according to the commission percentage provided. You need to calculate the
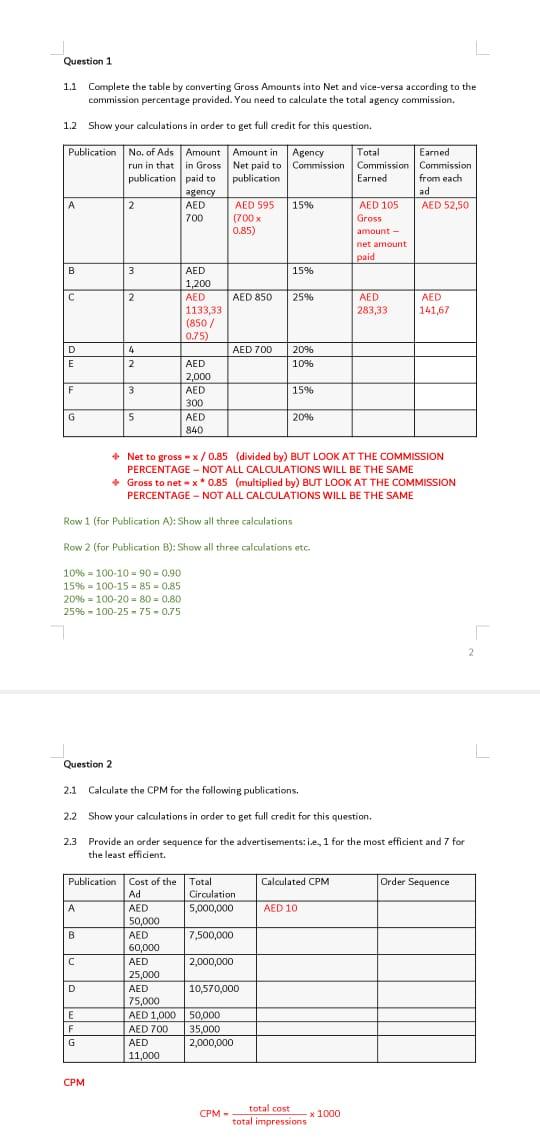
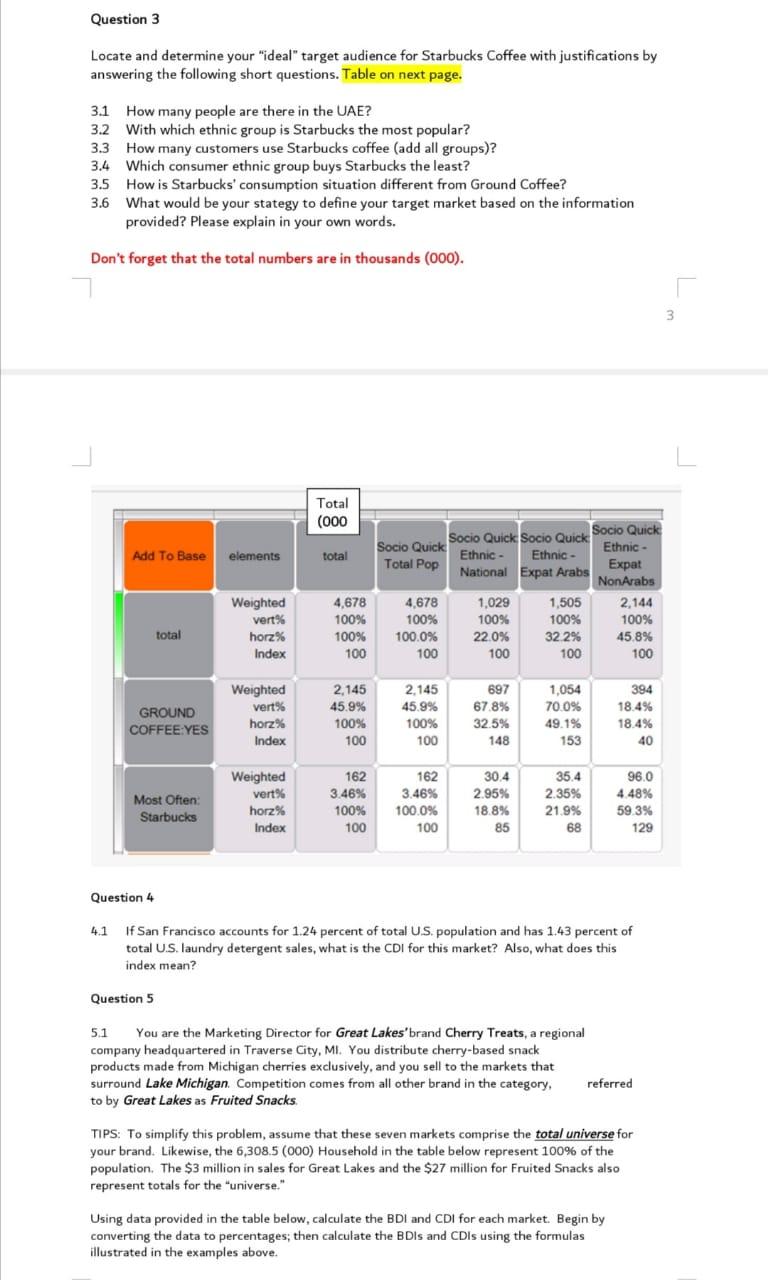
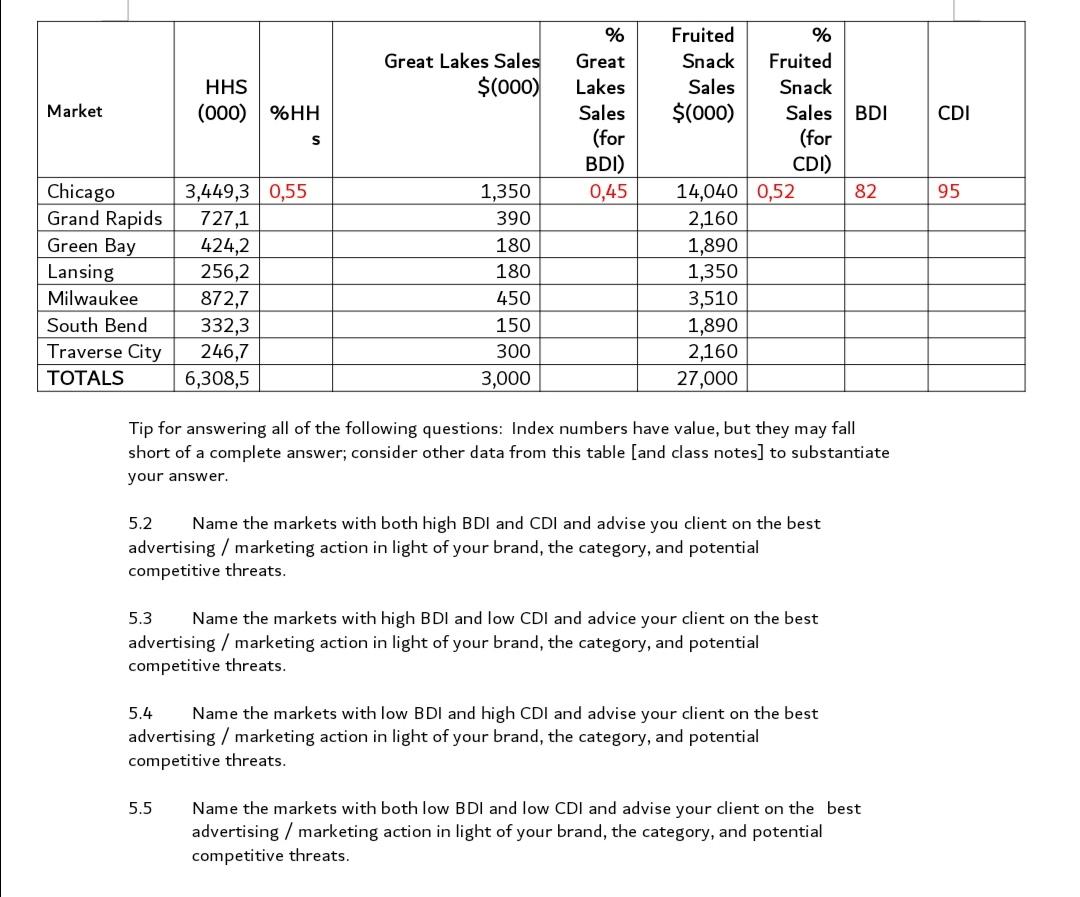
Question 1 1.1 Complete the table by converting Gross Amounts into Net and vice-versa according to the commission percentage provided. You need to calculate the total agency commission, 1.2 Show your calculations in order to get full credit for this question Publication No. of Ads Amount Amount in Agency Total Earned run in that in Gross Net paid to Commission Commission Commission publication paid to publication Earned from each agency ad 2 AED AED 595 15% AED 105 AED 52,50 700 (700x Gross 0.85) amount - net amount paid B 3 AED 15% 1,200 C 2 AED AED 850 25% AED AED 1133,33 283,33 141,67 (850 / 0.75) D 4 AED 700 20% E 2 AED 10% 2,000 F 3 AED 15% 300 5 AED 20% 840 + Net to gross -x/0.85 (divided by) BUT LOOK AT THE COMMISSION PERCENTAGE - NOT ALL CALCULATIONS WILL BE THE SAME + Gross to net - ** 0.85 (multiplied by) BUT LOOK AT THE COMMISSION PERCENTAGE - NOT ALL CALCULATIONS WILL BE THE SAME Row 1 (for Publication A): Show all three calculations Row 2 (for Publication B): Show all three calculations etc. 10% = 100-10 = 90 = 0.90 15% = 100-15-85 -0.85 20% = 100-20 - 80 - 0,80 25% - 100-25 - 75 -0.75 2 Question 2 2.1 Calculate the CPM for the following publications, , 2.2 Show your calculations in order to get full credit for this question. Provide an order sequence for the advertisements: le, 1 for the most efficient and 7 for the least efficient. Calculated CPM Order Sequence AED 10 Publication Cost of the Total Ad Circulation A AED 5,000,000 50,000 B AED 7,500,000 60,000 AED 2,000,000 25,000 D AED 10,570,000 75,000 AED 1.000 E F 50,000 35,000 2,000,000 AED 700 AED 11,000 G CPM CPM total impressions total cost x 1000 Question 3 Locate and determine your "ideal" target audience for Starbucks Coffee with justifications by answering the following short questions. Table on next page. 3.1 How many people are there in the UAE? 3.2 With which ethnic group is Starbucks the most popular? 3.3 How many customers use Starbucks coffee (add all groups)? 3.4 Which consumer ethnic group buys Starbucks the least? 3.5 How is Starbucks' consumption situation different from Ground Coffee? 3.6 What would be your stategy to define your target market based on the information provided? Please explain in your own words. Don't forget that the total numbers are in thousands (000). 3 Total (000 Add To Base elements total Socio Quick Socio Quick Socio Quick Socio Quick Ethnic - Ethnic - Ethnic - Total Pop National Expat Arabs Expat NonArabs 4,678 1,029 1,505 2,144 100% 100% 100% 100% 100.0% 22.0% 32.2% 45.8% 100 100 100 100 4,678 100% total Weighted vert% horz% Index 100% 100 GROUND COFFEE:YES Weighted vert% horz% Index 2,145 45.9% 100% 100 2.145 45.9% 100% 100 697 678% 32.5% 148 1,054 70.0% 49.1% 153 394 18.4% 18.4% 40 Most Often Starbucks Weighted vert% horz% Index 162 3.46% 100% 100 162 3.46% 100.0% 100 30.4 2.95% 18.8% 85 35.4 2.35% 21.9% 68 96.0 4 48% 59.3% 129 Question 4 4.1 If San Francisco accounts for 1.24 percent of total U.S. population and has 1.43 percent of total U.S. laundry detergent sales, what is the CDI for this market? Also, what does this index mean? Question 5 5.1 You are the Marketing Director for Great Lakes' brand Cherry Treats, a regional company headquartered in Traverse City, MI. You distribute cherry-based snack products made from Michigan cherries exclusively, and you sell to the markets that surround Lake Michigan Competition comes from all other brand in the category, referred to by Great Lakes as Fruited Snacks TIPS: To simplify this problem, assume that these seven markets comprise the total universe for your brand. Likewise, the 6,308.5 (000) Household in the table below represent 100% of the population. The $3 million in sales for Great Lakes and the $27 million for Fruited Snacks also represent totals for the "universe." Using data provided in the table below, calculate the BDI and CDI for each market. Begin by converting the data to percentages; then calculate the BDls and CDIs using the formulas illustrated in the examples above. Great Lakes Sales $(000) HHS (000) %HH % Great Lakes Sales (for BDI) Market CDI S 0,45 95 Chicago Grand Rapids Green Bay Lansing Milwaukee South Bend Traverse City TOTALS 3,449,3 0,55 727,1 424,2 256,2 872,7 332,3 246,7 6,308,5 1,350 390 180 180 450 150 300 3,000 Fruited % Snack Fruited Sales Snack $(000) Sales BDI (for CDI) 14,040 0,52 82 2,160 1,890 1,350 3,510 1,890 2,160 27,000 Tip for answering all of the following questions: Index numbers have value, but they may fall short of a complete answer; consider other data from this table (and class notes] to substantiate your answer. 5.2 Name the markets with both high BDI and CDI and advise you client on the best advertising / marketing action in light of your brand, the category, and potential competitive threats. 5.3 Name the markets with high BDI and low CDI and advice your client on the best advertising marketing action in light of your brand, the category, and potential competitive threats. 5.4 Name the markets with low BDI and high CDI and advise your client on the best advertising marketing action in light of your brand, the category, and potential competitive threats. 5.5 Name the markets with both low BDI and low CDI and advise your client on the best advertising marketing action in light of your brand, the category, and potential competitive threats. Question 1 1.1 Complete the table by converting Gross Amounts into Net and vice-versa according to the commission percentage provided. You need to calculate the total agency commission, 1.2 Show your calculations in order to get full credit for this question Publication No. of Ads Amount Amount in Agency Total Earned run in that in Gross Net paid to Commission Commission Commission publication paid to publication Earned from each agency ad 2 AED AED 595 15% AED 105 AED 52,50 700 (700x Gross 0.85) amount - net amount paid B 3 AED 15% 1,200 C 2 AED AED 850 25% AED AED 1133,33 283,33 141,67 (850 / 0.75) D 4 AED 700 20% E 2 AED 10% 2,000 F 3 AED 15% 300 5 AED 20% 840 + Net to gross -x/0.85 (divided by) BUT LOOK AT THE COMMISSION PERCENTAGE - NOT ALL CALCULATIONS WILL BE THE SAME + Gross to net - ** 0.85 (multiplied by) BUT LOOK AT THE COMMISSION PERCENTAGE - NOT ALL CALCULATIONS WILL BE THE SAME Row 1 (for Publication A): Show all three calculations Row 2 (for Publication B): Show all three calculations etc. 10% = 100-10 = 90 = 0.90 15% = 100-15-85 -0.85 20% = 100-20 - 80 - 0,80 25% - 100-25 - 75 -0.75 2 Question 2 2.1 Calculate the CPM for the following publications, , 2.2 Show your calculations in order to get full credit for this question. Provide an order sequence for the advertisements: le, 1 for the most efficient and 7 for the least efficient. Calculated CPM Order Sequence AED 10 Publication Cost of the Total Ad Circulation A AED 5,000,000 50,000 B AED 7,500,000 60,000 AED 2,000,000 25,000 D AED 10,570,000 75,000 AED 1.000 E F 50,000 35,000 2,000,000 AED 700 AED 11,000 G CPM CPM total impressions total cost x 1000 Question 3 Locate and determine your "ideal" target audience for Starbucks Coffee with justifications by answering the following short questions. Table on next page. 3.1 How many people are there in the UAE? 3.2 With which ethnic group is Starbucks the most popular? 3.3 How many customers use Starbucks coffee (add all groups)? 3.4 Which consumer ethnic group buys Starbucks the least? 3.5 How is Starbucks' consumption situation different from Ground Coffee? 3.6 What would be your stategy to define your target market based on the information provided? Please explain in your own words. Don't forget that the total numbers are in thousands (000). 3 Total (000 Add To Base elements total Socio Quick Socio Quick Socio Quick Socio Quick Ethnic - Ethnic - Ethnic - Total Pop National Expat Arabs Expat NonArabs 4,678 1,029 1,505 2,144 100% 100% 100% 100% 100.0% 22.0% 32.2% 45.8% 100 100 100 100 4,678 100% total Weighted vert% horz% Index 100% 100 GROUND COFFEE:YES Weighted vert% horz% Index 2,145 45.9% 100% 100 2.145 45.9% 100% 100 697 678% 32.5% 148 1,054 70.0% 49.1% 153 394 18.4% 18.4% 40 Most Often Starbucks Weighted vert% horz% Index 162 3.46% 100% 100 162 3.46% 100.0% 100 30.4 2.95% 18.8% 85 35.4 2.35% 21.9% 68 96.0 4 48% 59.3% 129 Question 4 4.1 If San Francisco accounts for 1.24 percent of total U.S. population and has 1.43 percent of total U.S. laundry detergent sales, what is the CDI for this market? Also, what does this index mean? Question 5 5.1 You are the Marketing Director for Great Lakes' brand Cherry Treats, a regional company headquartered in Traverse City, MI. You distribute cherry-based snack products made from Michigan cherries exclusively, and you sell to the markets that surround Lake Michigan Competition comes from all other brand in the category, referred to by Great Lakes as Fruited Snacks TIPS: To simplify this problem, assume that these seven markets comprise the total universe for your brand. Likewise, the 6,308.5 (000) Household in the table below represent 100% of the population. The $3 million in sales for Great Lakes and the $27 million for Fruited Snacks also represent totals for the "universe." Using data provided in the table below, calculate the BDI and CDI for each market. Begin by converting the data to percentages; then calculate the BDls and CDIs using the formulas illustrated in the examples above. Great Lakes Sales $(000) HHS (000) %HH % Great Lakes Sales (for BDI) Market CDI S 0,45 95 Chicago Grand Rapids Green Bay Lansing Milwaukee South Bend Traverse City TOTALS 3,449,3 0,55 727,1 424,2 256,2 872,7 332,3 246,7 6,308,5 1,350 390 180 180 450 150 300 3,000 Fruited % Snack Fruited Sales Snack $(000) Sales BDI (for CDI) 14,040 0,52 82 2,160 1,890 1,350 3,510 1,890 2,160 27,000 Tip for answering all of the following questions: Index numbers have value, but they may fall short of a complete answer; consider other data from this table (and class notes] to substantiate your answer. 5.2 Name the markets with both high BDI and CDI and advise you client on the best advertising / marketing action in light of your brand, the category, and potential competitive threats. 5.3 Name the markets with high BDI and low CDI and advice your client on the best advertising marketing action in light of your brand, the category, and potential competitive threats. 5.4 Name the markets with low BDI and high CDI and advise your client on the best advertising marketing action in light of your brand, the category, and potential competitive threats. 5.5 Name the markets with both low BDI and low CDI and advise your client on the best advertising marketing action in light of your brand, the category, and potential competitive threats
Step by Step Solution
There are 3 Steps involved in it

Get step-by-step solutions from verified subject matter experts