

Question: Question 1 3 pts Let us consider an ant population which can be modeled by f (x) = 1, 200 - 1.12, a bee
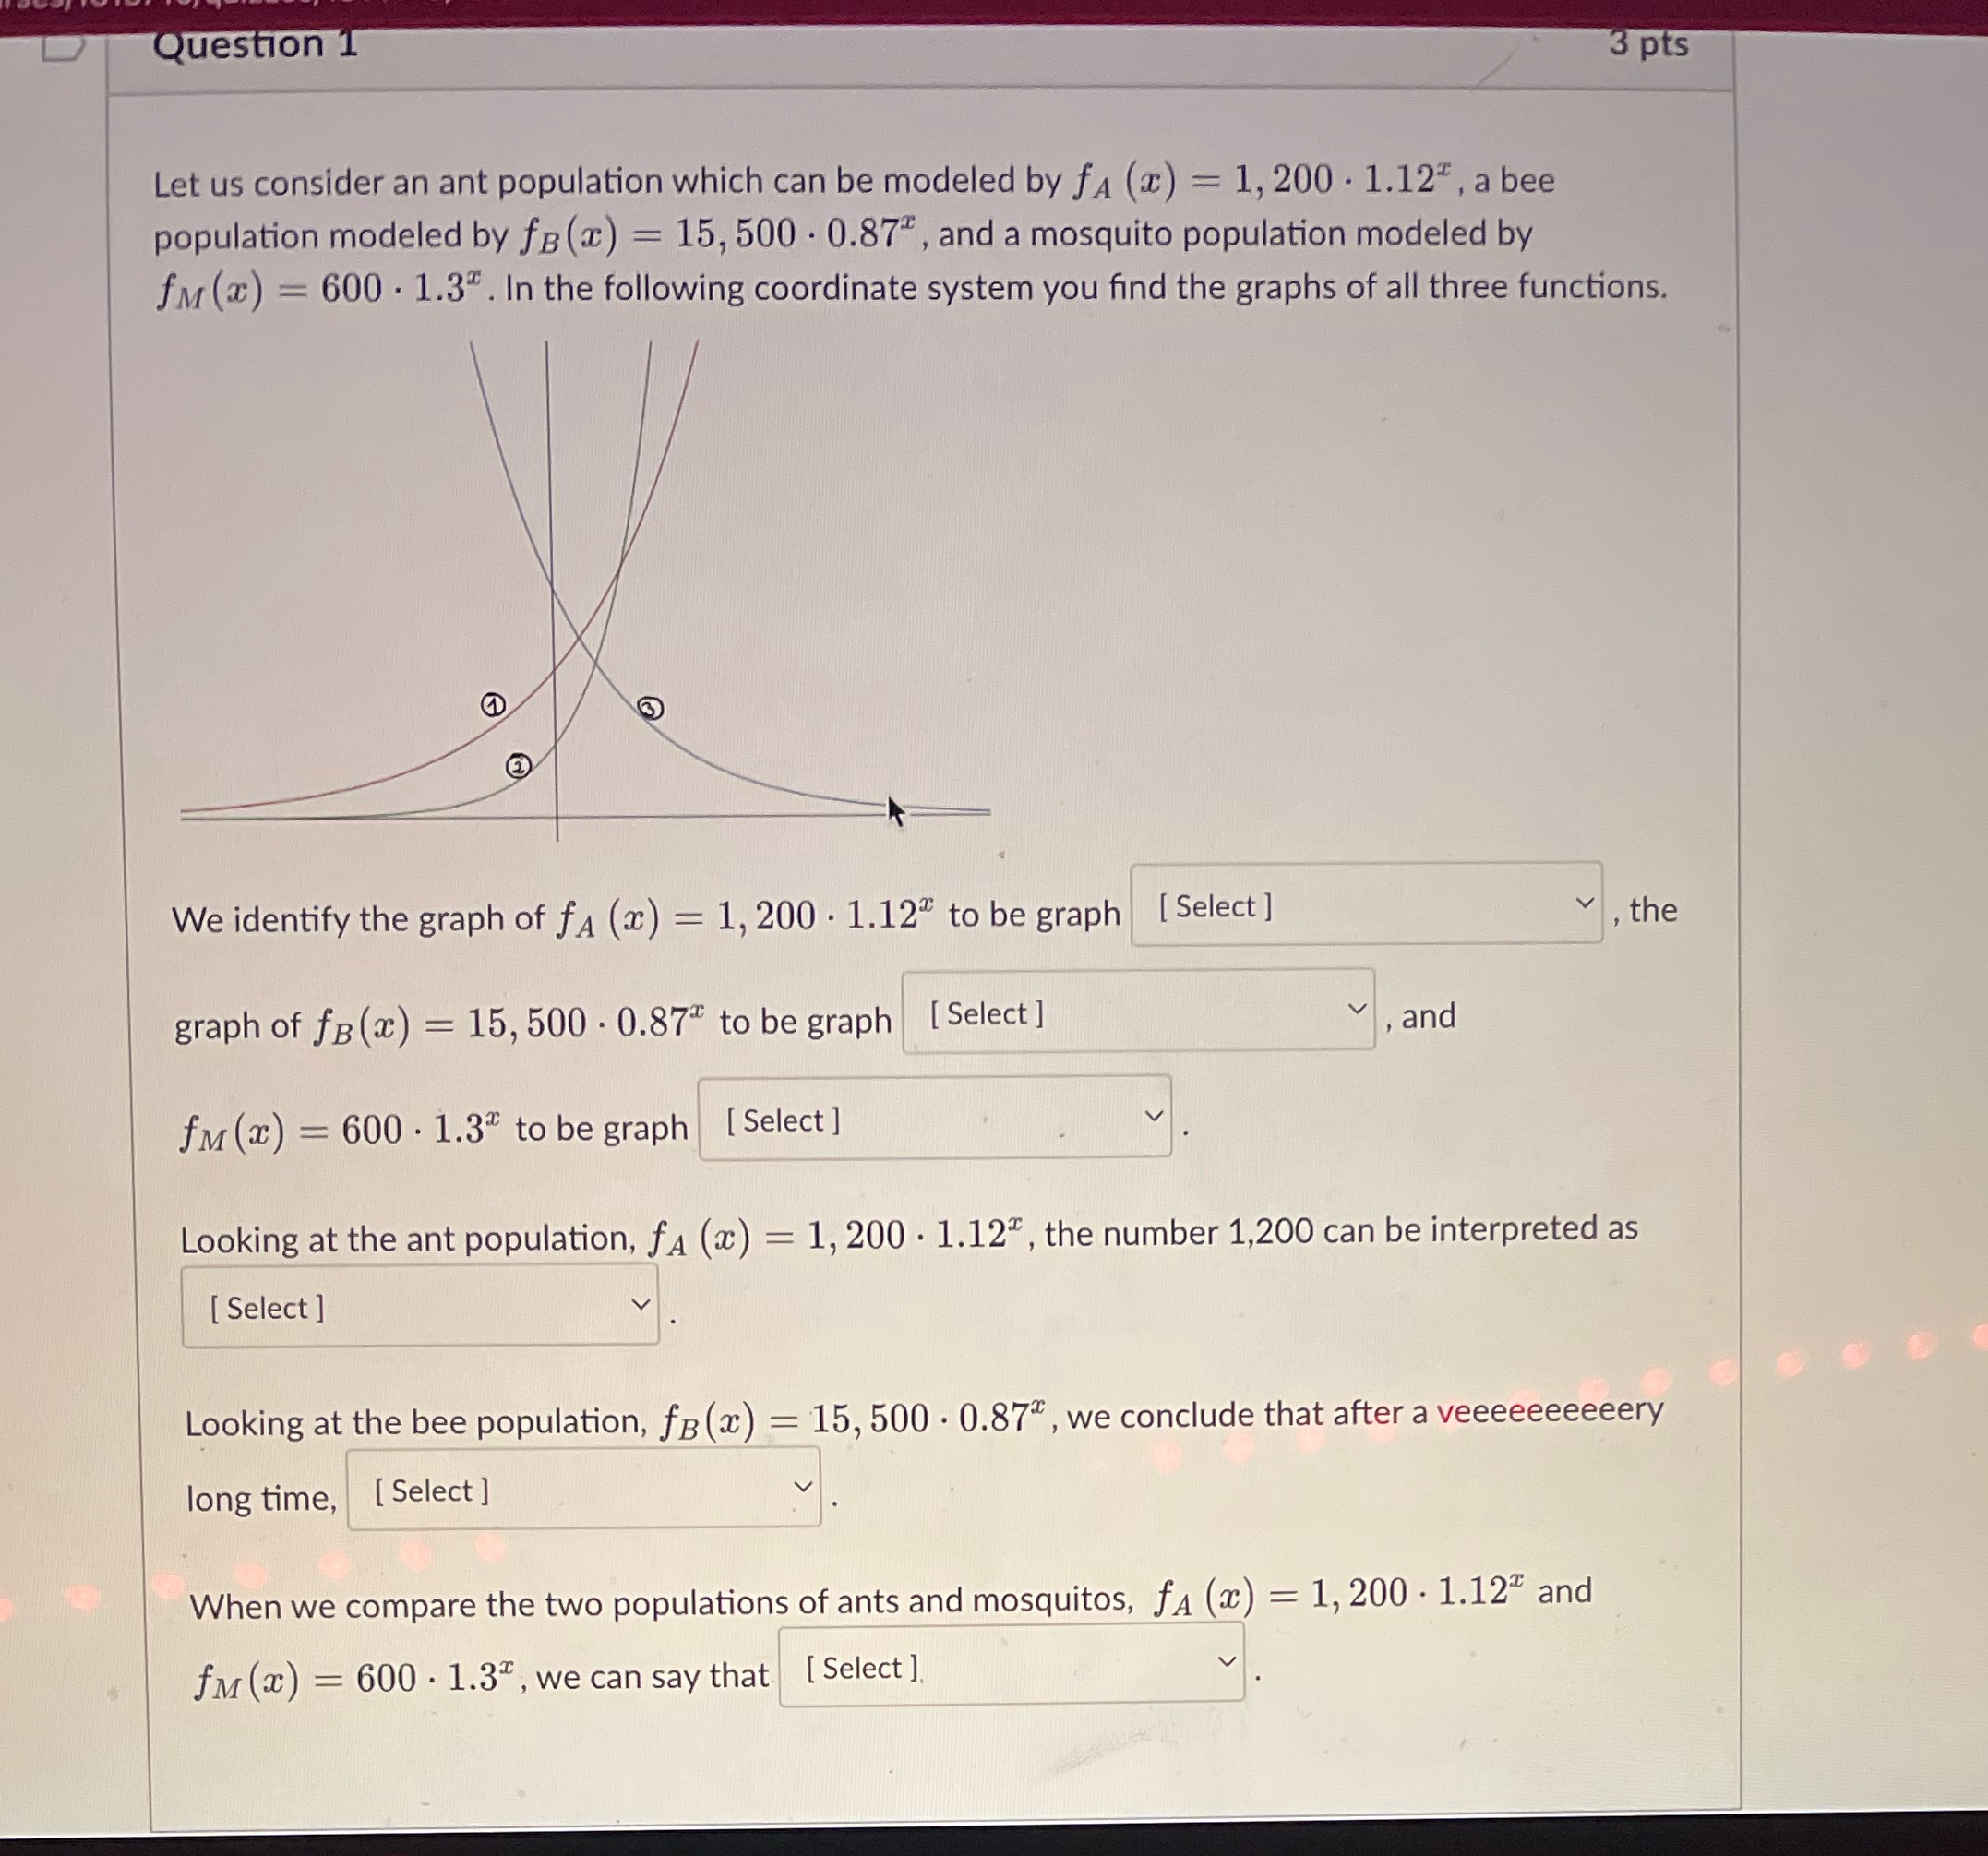
Question 1 3 pts Let us consider an ant population which can be modeled by f (x) = 1, 200 - 1.12, a bee population modeled by B(x) = 15, 500 0.87, and a mosquito population modeled by f(x)=600 1.3%. In the following coordinate system you find the graphs of all three functions. G We identify the graph of f (x) = 1, 200 1.12 to be graph [Select] graph of f(x) = 15, 500 0.87 to be graph [Select] f(x)=600 1.3% to be graph [Select] the , and Looking at the ant population, f (x) = 1, 200 1.12, the number 1,200 can be interpreted as [Select] Looking at the bee population, fB (x) = 15, 500 0.87, we conclude that after a veeeeeeeeeery long time, [Select] When we compare the two populations of ants and mosquitos, f (x) = 1, 200 1.12" and f(x)=600 1.3%, we can say that [Select],
Step by Step Solution
There are 3 Steps involved in it

Get step-by-step solutions from verified subject matter experts