

Question: Question #1 (40 points) Download monthly adjusted close price data for Apple (AAPL, Stock A) and Amazon (AMZN, Stock B) for the period of Sep.
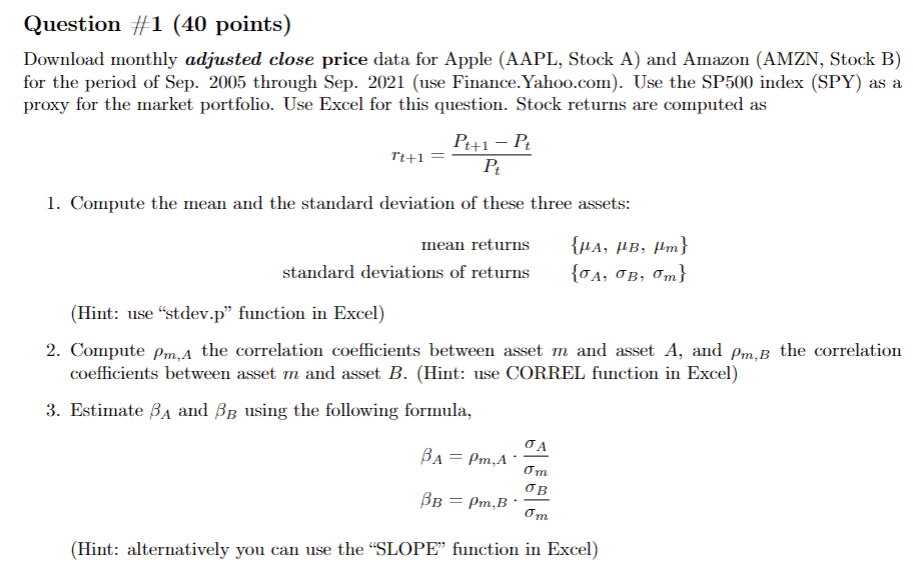
Question #1 (40 points) Download monthly adjusted close price data for Apple (AAPL, Stock A) and Amazon (AMZN, Stock B) for the period of Sep. 2005 through Sep. 2021 (use Finance.Yahoo.com). Use the SP500 index (SPY) as a proxy for the market portfolio. Use Excel for this question. Stock returns are computed as Pt+1 Pt P Tt+1 1. Compute the mean and the standard deviation of these three assets: mean returns standard deviations of returns {, , m} {, B, m} (Hint: use "stdev.p function in Excel) 2. Compute Pm,A the correlation coefficients between asset m and asset A, and Pm,B the correlation coefficients between asset m and asset B. (Hint: use CORREL function in Excel) 3. Estimate BA and BB using the following formula, BA = Pm, A om OB BB = Pm,B (Hint: alternatively you can use the "SLOPE" function in Excel) Question #1 (40 points) Download monthly adjusted close price data for Apple (AAPL, Stock A) and Amazon (AMZN, Stock B) for the period of Sep. 2005 through Sep. 2021 (use Finance.Yahoo.com). Use the SP500 index (SPY) as a proxy for the market portfolio. Use Excel for this question. Stock returns are computed as Pt+1 Pt P Tt+1 1. Compute the mean and the standard deviation of these three assets: mean returns standard deviations of returns {, , m} {, B, m} (Hint: use "stdev.p function in Excel) 2. Compute Pm,A the correlation coefficients between asset m and asset A, and Pm,B the correlation coefficients between asset m and asset B. (Hint: use CORREL function in Excel) 3. Estimate BA and BB using the following formula, BA = Pm, A om OB BB = Pm,B (Hint: alternatively you can use the "SLOPE" function in Excel)
Step by Step Solution
There are 3 Steps involved in it

Get step-by-step solutions from verified subject matter experts