

Question: Question 1 (7 marks) The data in the table below presents the hourly quantity of production for three lines of production processes over the first
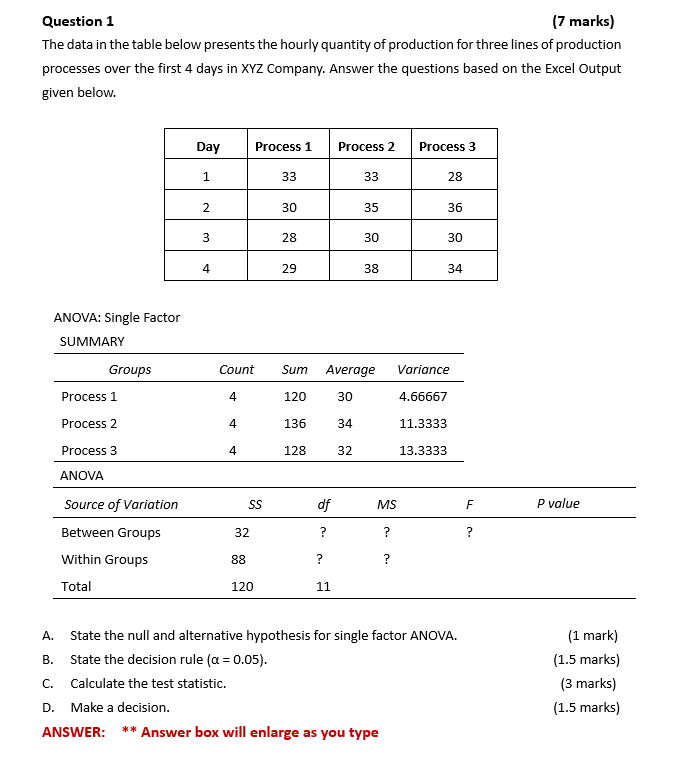

Question 1 (7 marks) The data in the table below presents the hourly quantity of production for three lines of production processes over the first 4 days in XYZ Company. Answer the questions based on the Excel Output given below. Day Process 1 Process 2 Process 3 1 33 33 28 2 30 35 36 3 28 30 30 4 29 38 34 ANOVA: Single Factor SUMMARY Groups Count Sum Average Variance Process 1 4 120 30 4.66667 Process 2 4 136 34 11.3333 Process 3 128 32 13.3333 ANOVA Source of Variation SS of MS F P value Between Groups 32 ? Within Groups 88 Total 120 11 A. State the null and alternative hypothesis for single factor ANOVA. (1 mark) B. State the decision rule (a = 0.05). (1.5 marks) C. Calculate the test statistic. (3 marks) D. Make a decision. (1.5 marks) ANSWER: ** Answer box will enlarge as you type
Step by Step Solution
There are 3 Steps involved in it

Get step-by-step solutions from verified subject matter experts