

Question: The data in the table below presents the hourly quantity of production for three lines of production processes over the first 4 days in XYZ
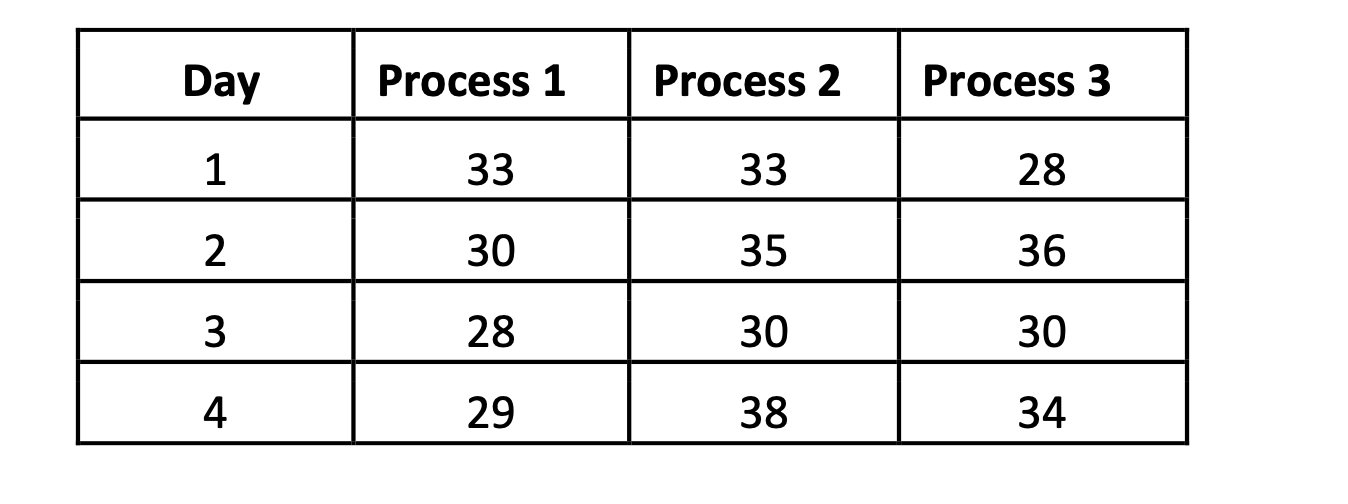
The data in the table below presents the hourly quantity of production for three lines of production processes over the first 4 days in XYZ Company. Answer the questions based on the Excel Output given below.
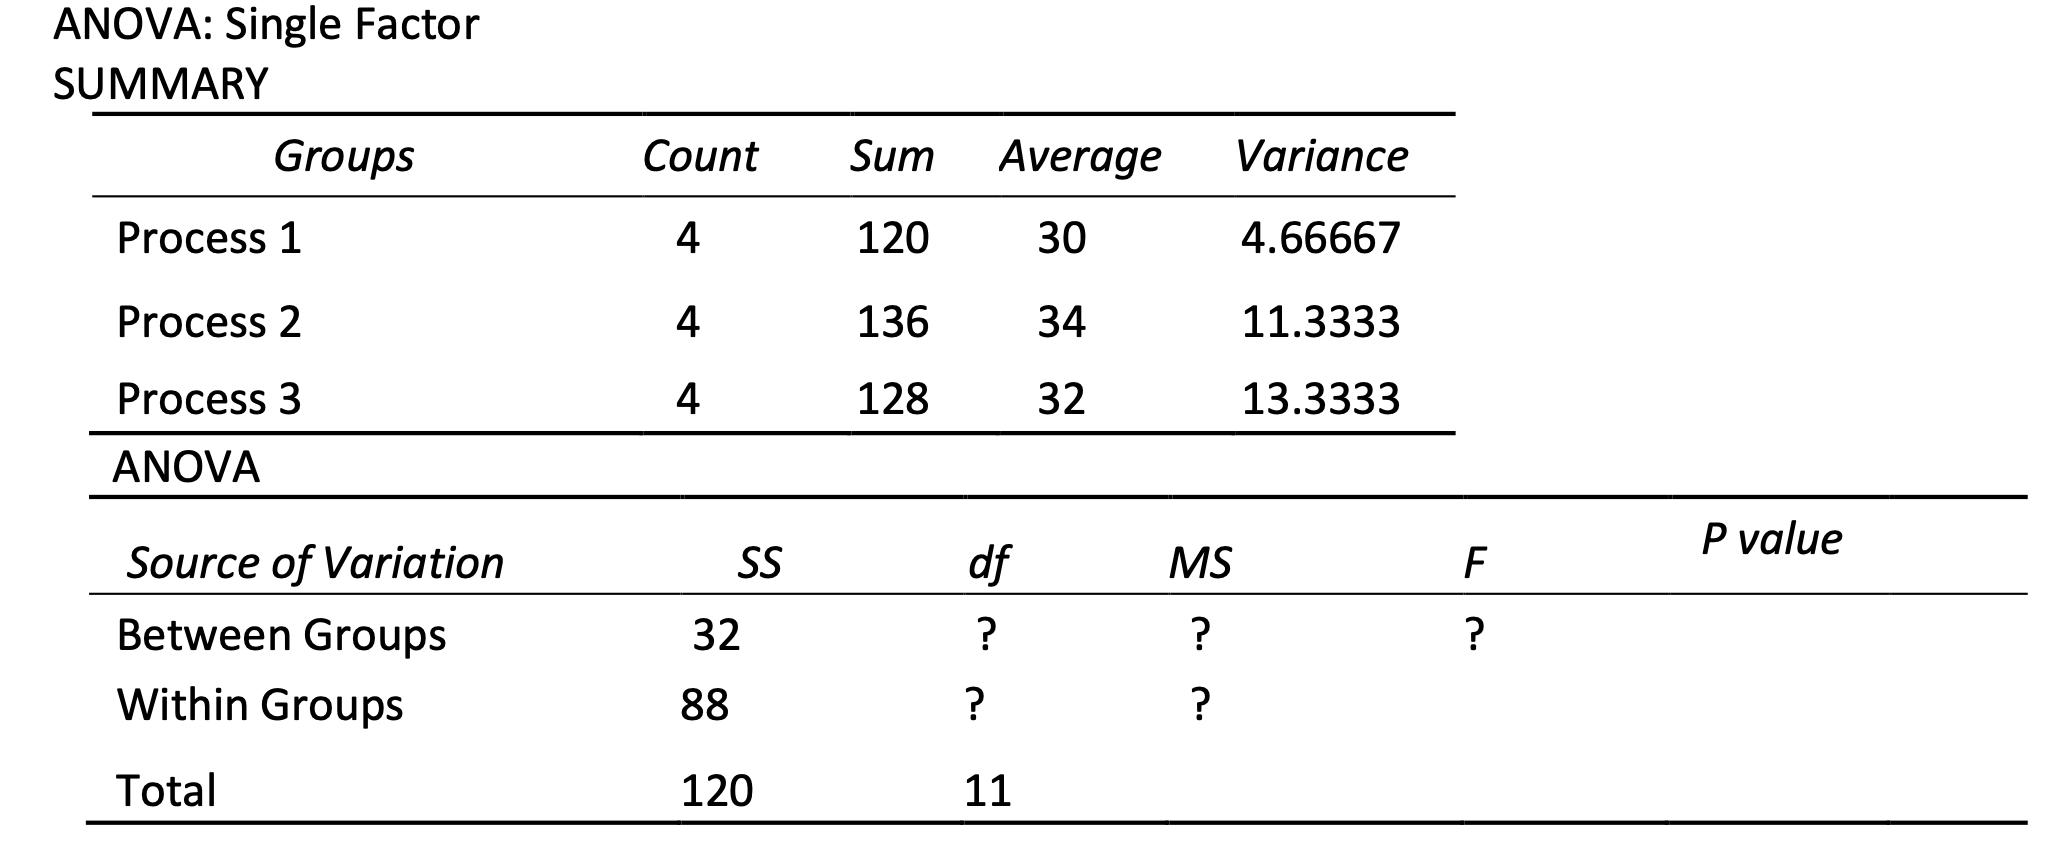
ANOVA: Single Factor SUMMARY Groups Process 1 Process 2 Process 3 ANOVA Source of Variation Between Groups Within Groups Total Count 55 32 88 120 Sum Average 120 136 128 30 34 32 Variance 4.66667 11.3333 13.3333 P value \f
Step by Step Solution
There are 3 Steps involved in it
1 Expert Approved Answer
Step: 1 Unlock

Question Has Been Solved by an Expert!
Get step-by-step solutions from verified subject matter experts
Step: 2 Unlock
Step: 3 Unlock