

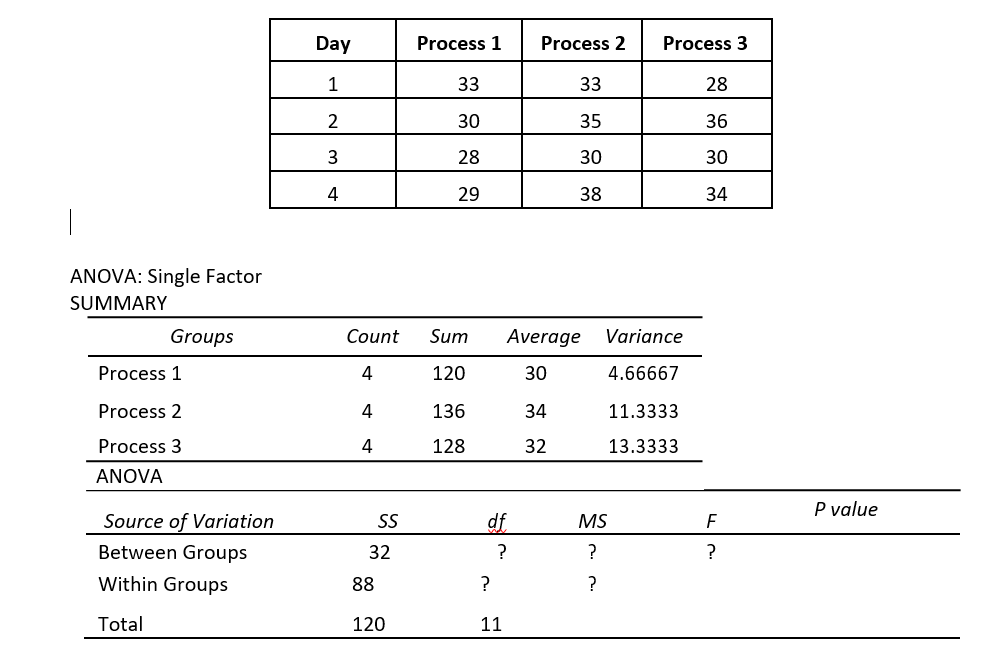
Question: The data in the table below presents the hourly quantity of production for three lines of production processes over the first 4 days in XYZ
The data in the table below presents the hourly quantity of production for three lines of production
processes over the first 4 days in XYZ Company. Answer the questions based on the Excel Output given
below.
a.
State the null and alternative hypothesis for single factor ANOVA.
b.
State the decision rule (? = 0.05).
c.
Calculate the test statistic.
d.
Make a decision.
\f
Step by Step Solution
There are 3 Steps involved in it
1 Expert Approved Answer
Step: 1 Unlock

Question Has Been Solved by an Expert!
Get step-by-step solutions from verified subject matter experts
Step: 2 Unlock
Step: 3 Unlock