

Question: QUESTION 1 a. Using PIPE-FLO, fill in the table below with the correct viscosity values for carbon dioxide at standard atmospheric pressure. Temperature Viscosity (C)
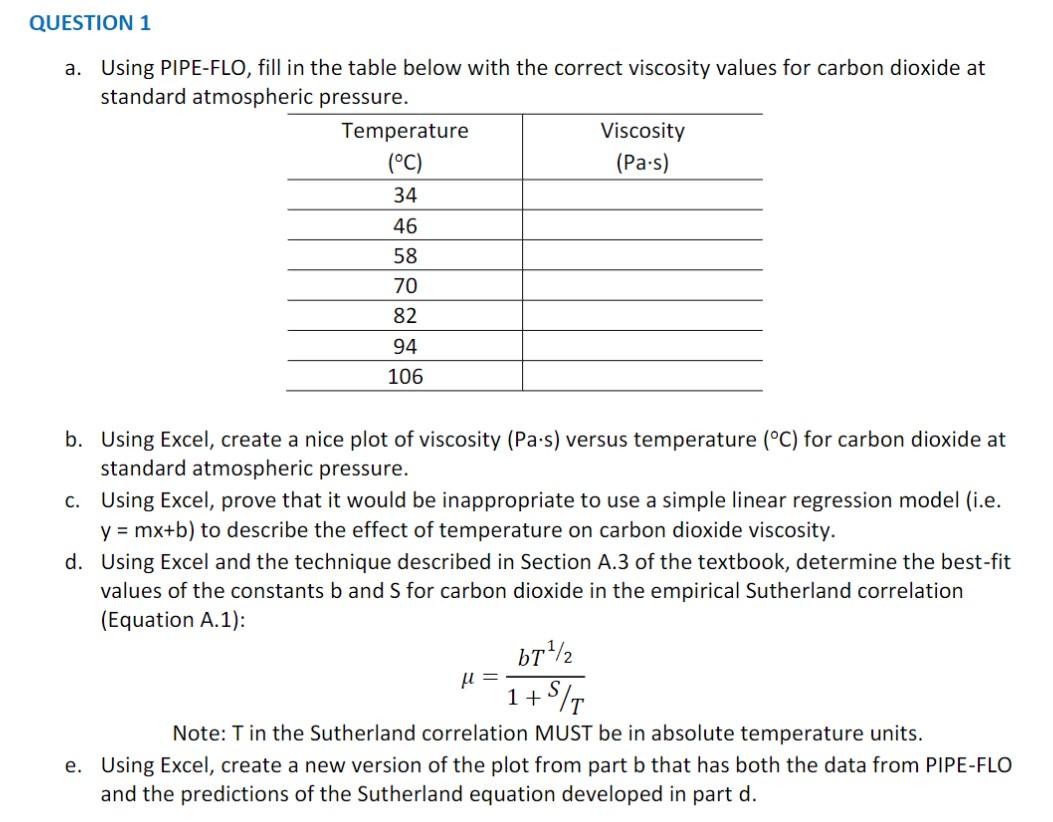
QUESTION 1 a. Using PIPE-FLO, fill in the table below with the correct viscosity values for carbon dioxide at standard atmospheric pressure. Temperature Viscosity (C) (Pa.s) 34 46 58 70 82 94 106 b. Using Excel, create a nice plot of viscosity (Pa.s) versus temperature (C) for carbon dioxide at standard atmospheric pressure. C. Using Excel, prove that it would be inappropriate to use a simple linear regression model (i.e. y = mx+b) to describe the effect of temperature on carbon dioxide viscosity. d. Using Excel and the technique described in Section A.3 of the textbook, determine the best-fit values of the constants b and S for carbon dioxide in the empirical Sutherland correlation (Equation A.1): bT1/2 M= 1+S/T Note: T in the Sutherland correlation MUST be in absolute temperature units. e. Using Excel, create a new version of the plot from part b that has both the data from PIPE-FLO and the predictions of the Sutherland equation developed in part d
Step by Step Solution
There are 3 Steps involved in it

Get step-by-step solutions from verified subject matter experts