

Question: QUESTION 1 and 4: Please and thanks! estion Completion Status: QUESTION 1 Determine the fraction of nonconforming product control chart upper limit when the standard
QUESTION 1 and 4: Please and thanks! 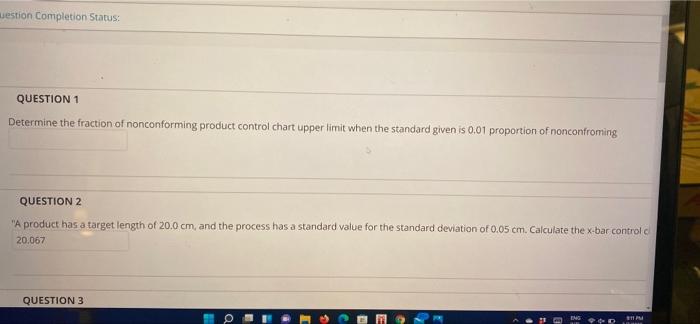
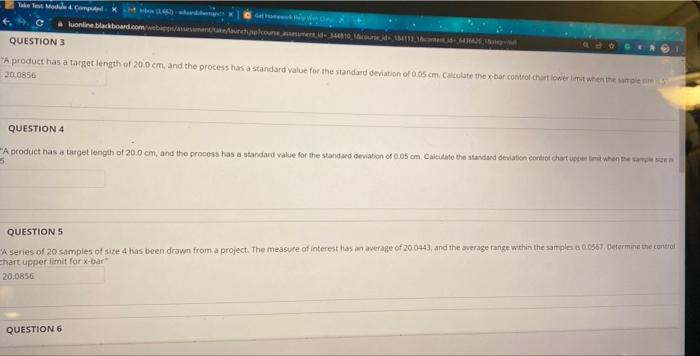
estion Completion Status: QUESTION 1 Determine the fraction of nonconforming product control chart upper limit when the standard given is 0.01 proportion of nonconfroming QUESTION 2 "A product has a target length of 20.0 cm, and the process has a standard value for the standard deviation of 0.05 cm. Calculate the x-bar control 20.067 QUESTION 3 111 PM Toe Test Modul cum luonline blackboard.com/w/wholown - 34000 180011, EN QUESTION 3 A product has a target length of 20.0 cm, and the process as a standard value for the standard deviation of a cm. Calculate the bar control chart lower whetheme 20.0856 QUESTION 4 A product has a target length of 200 cm, and the process has a standard value for the standard deviation of 0.05 cm Calculate the standard deviation control chart up when 5 QUESTIONS a series of 20 samples of size 4 has been drawn from a project. The measure of interest has an average of 20.0443, and the average range within the samples is 0.0567. Determine the control Chart upper limit for X-bar 20.0856 QUESTION 6 Step by Step Solution
There are 3 Steps involved in it
1 Expert Approved Answer
Step: 1 Unlock

Question Has Been Solved by an Expert!
Get step-by-step solutions from verified subject matter experts
Step: 2 Unlock
Step: 3 Unlock