

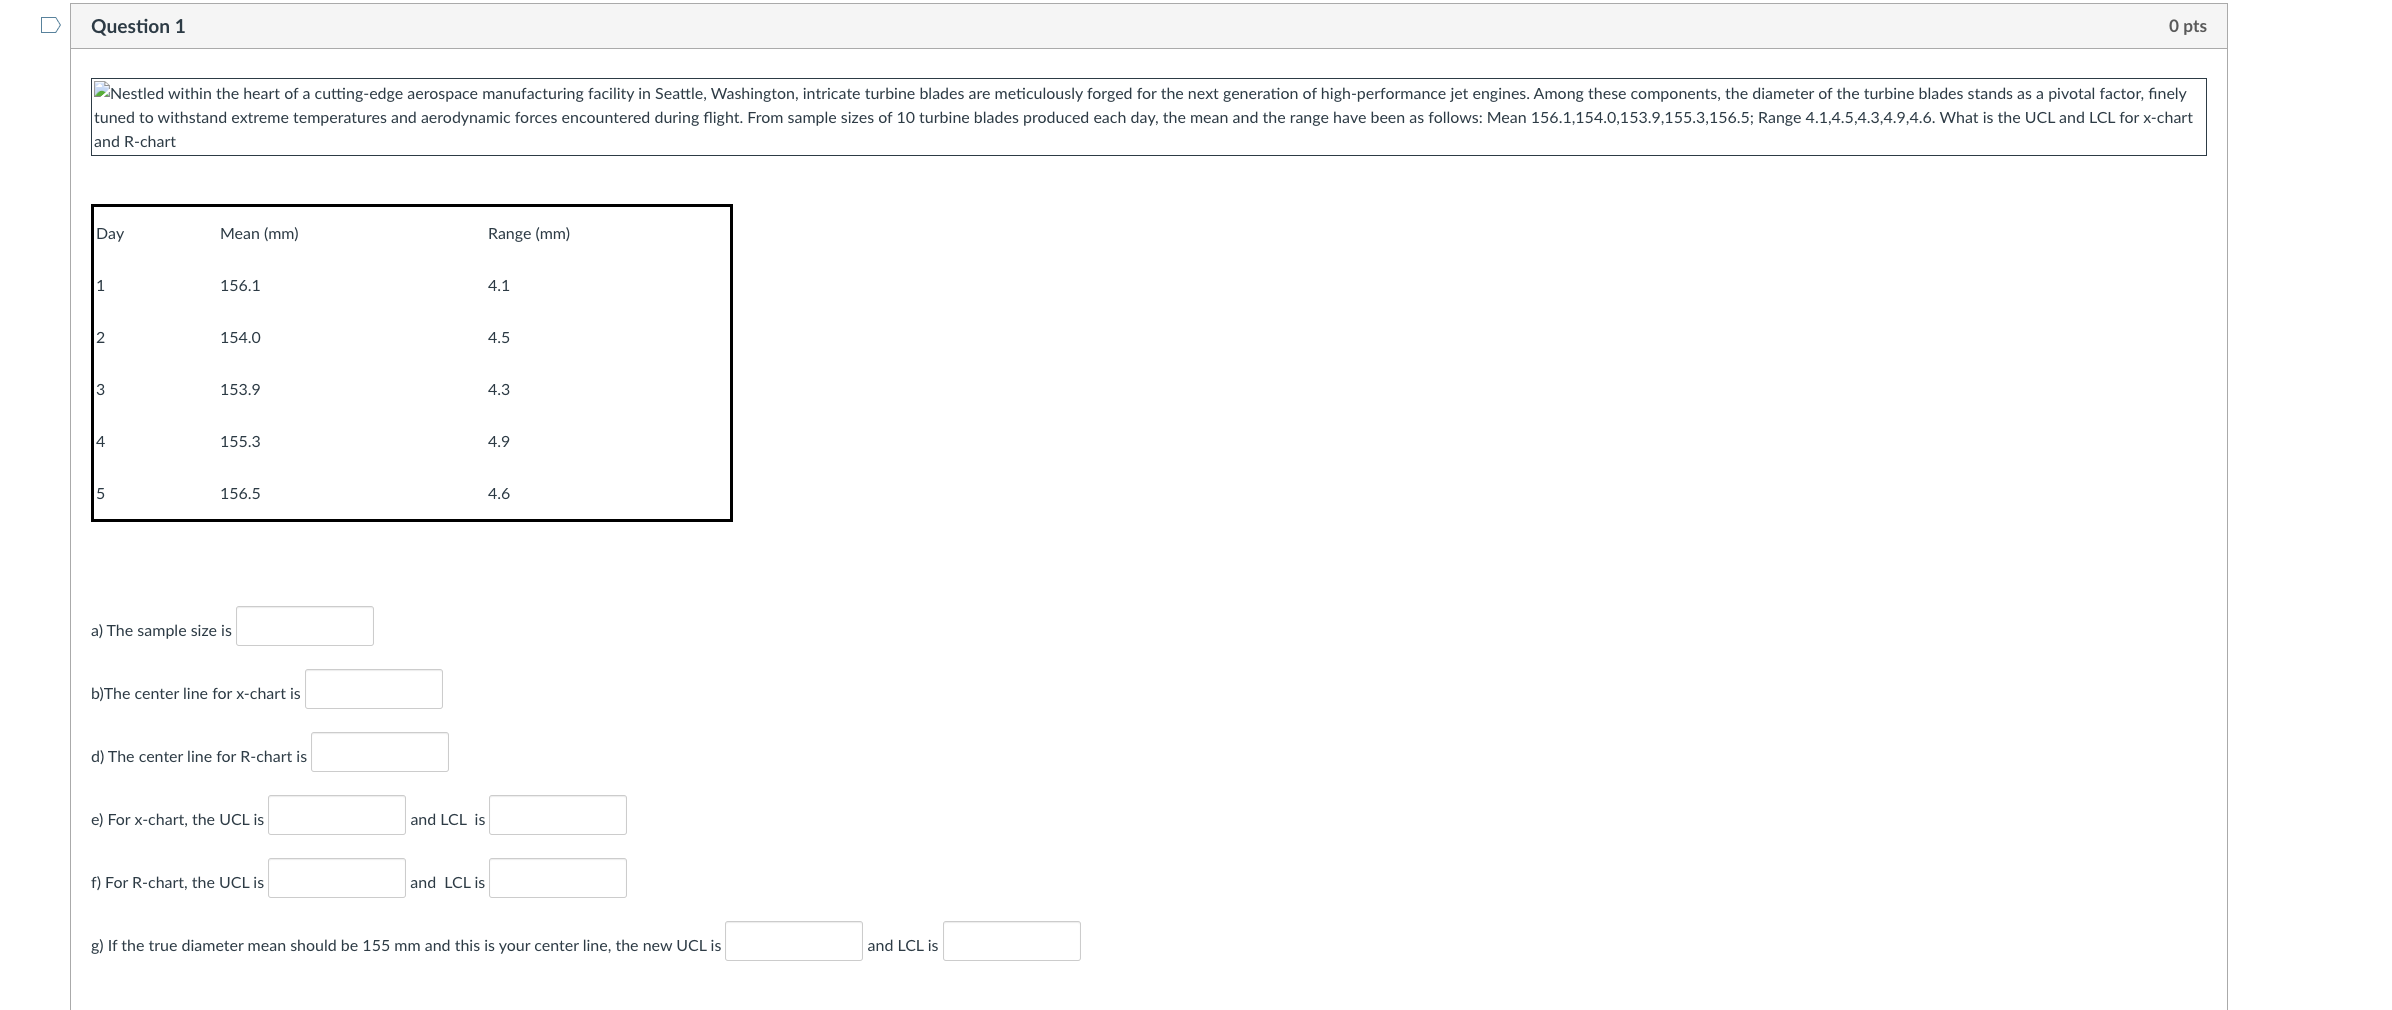
Question: Question 1 and R - chart a ) The sample size is b ) The center line for ( x ) - chart
Question
and Rchart
a The sample size is
b The center line for x chart is
d The center line for Rchart is
e For x chart, the UCL is
and L C L is
f For Rchart, the UCL i:
and LCLi
g If the true diameter mean should be mm and this is your center line, the new UCL is and LCL is
Step by Step Solution
There are 3 Steps involved in it
1 Expert Approved Answer
Step: 1 Unlock

Question Has Been Solved by an Expert!
Get step-by-step solutions from verified subject matter experts
Step: 2 Unlock
Step: 3 Unlock