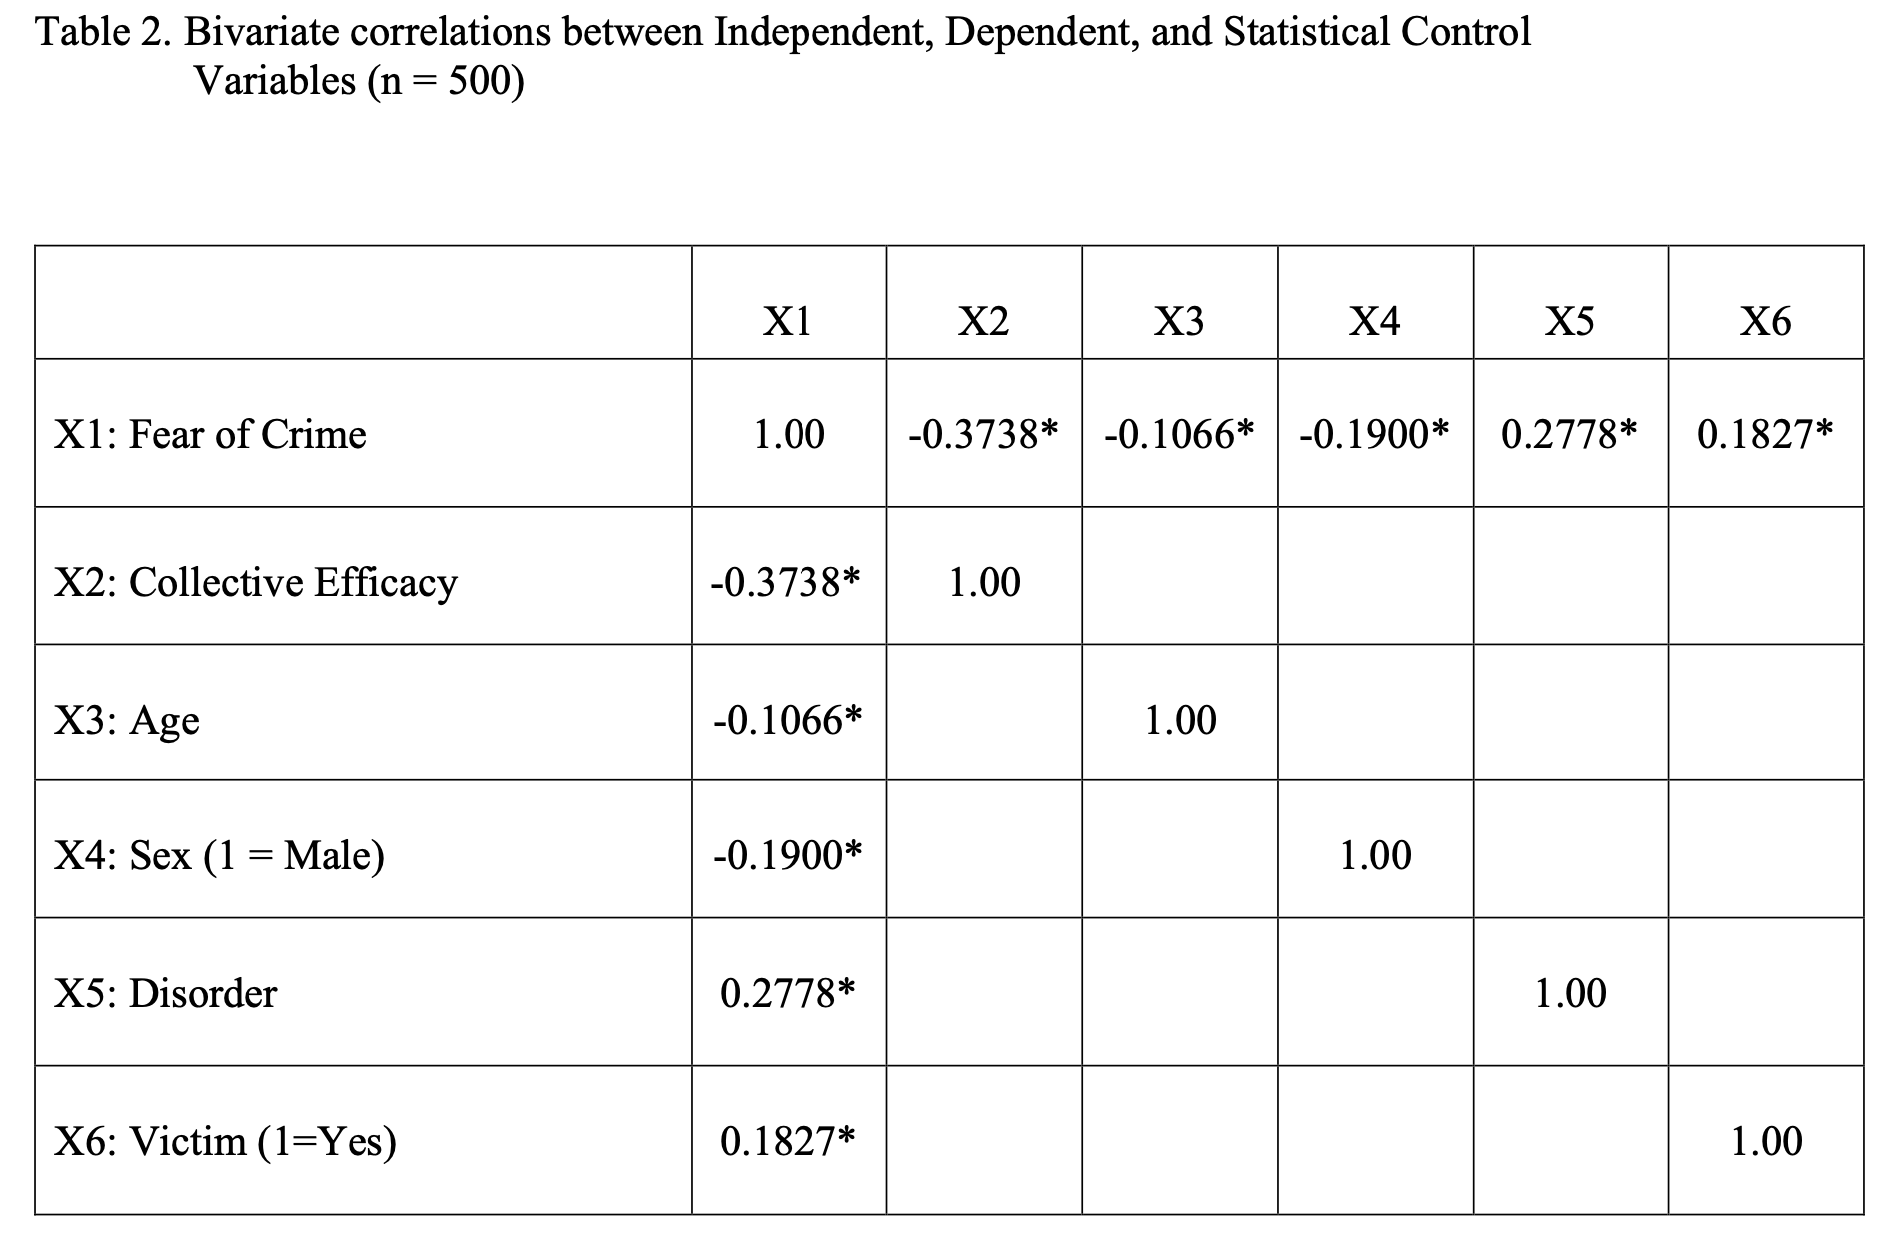
Question: Question 1 : Based on the STATA statistics below, please fill out the Table 2 below. Complete the Table 2 by typing the correlation coefficients

 Question 1: Based on the STATA statistics below, please fill outthe Table 2 below. Complete the Table 2 by typing the correlationcoefficients into the correct cells. You should use asterisks to indicate correlationsthat are statistically significant at p \fTable 2. Bivariate correlations between Independent,

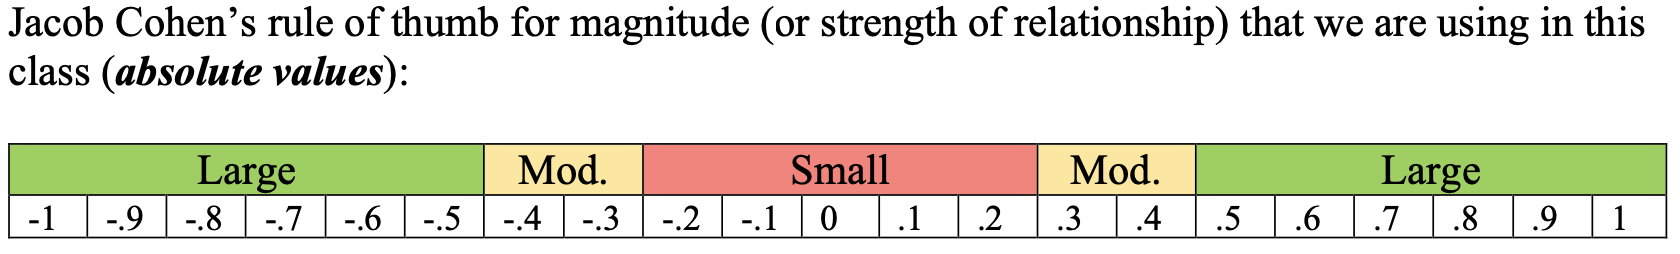
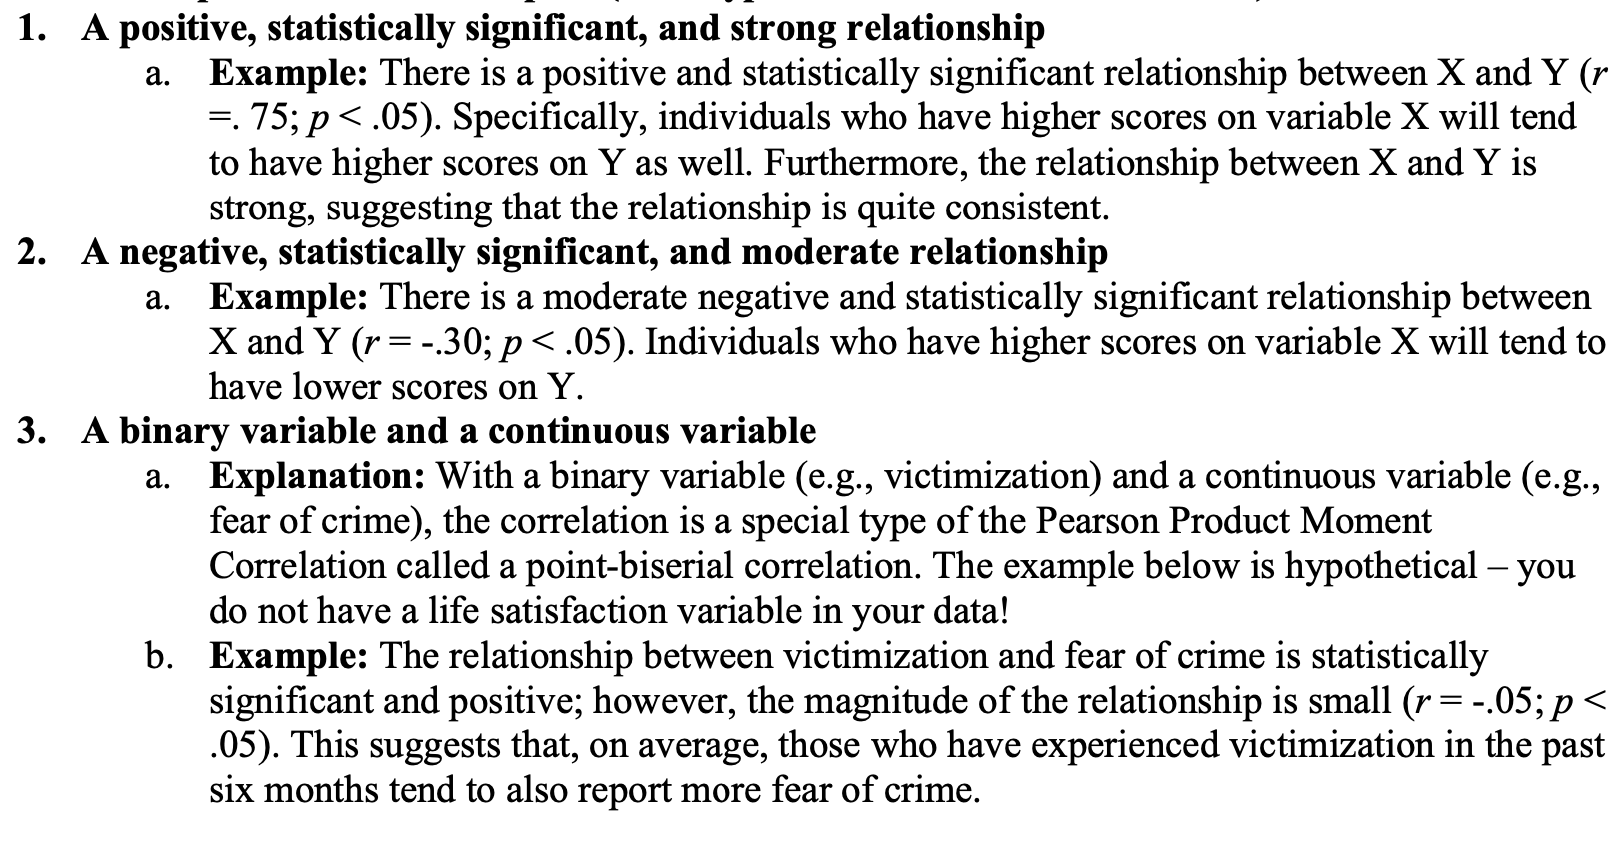
Question 1: Based on the STATA statistics below, please fill out the Table 2 below. Complete the Table 2 by typing the correlation coefficients into the correct cells. You should use asterisks to indicate correlations that are statistically significant at p

Dependent, and Statistical Control Variables (n = 500) X1 X2 X3 X4X5 X6 X1: Fear of Crime 1.00 -0.3738* -0.1066* -0.1900* 0.2778* 0.1827*X2: Collective Efficacy -0.3738* 1.00 X3: Age -0.1066* 1.00 X4: Sex (1= Male) -0.1900* 1.00 X5: Disorder 0.2778* 1.00 X6: Victim (1=Yes) 0.1827*
\fTable 2. Bivariate correlations between Independent, Dependent, and Statistical Control Variables (n = 500) X1 X2 X3 X4 X5 X6 X1: Fear of Crime 1.00 -0.3738* -0.1066* -0.1900* 0.2778* 0.1827* X2: Collective Efficacy -0.3738* 1.00 X3: Age -0.1066* 1.00 X4: Sex (1 = Male) -0.1900* 1.00 X5: Disorder 0.2778* 1.00 X6: Victim (1=Yes) 0.1827* 1.00Jacob Cohen's rule of thumb for magnitude (or strength of relationship) that we are using in this class (absolute values): 1. A positive, statistically significant, and strong relationship a. Example: There is a positive and statistically significant relationship between X and Y (r =. 75; p <.05 specifically individuals who have higher scores on variable x will tend to y as well. furthermore the relationship between and is strong suggesting that quite consistent. a negative statistically significant moderate a. example: there p lower y. binary continuous explanation: with victimization fear of crime correlation special type pearson product moment called point-biserial correlation. example below hypothetical you do not life satisfaction in your data b. positive however magnitude small this suggests average those experienced past six months also report more>

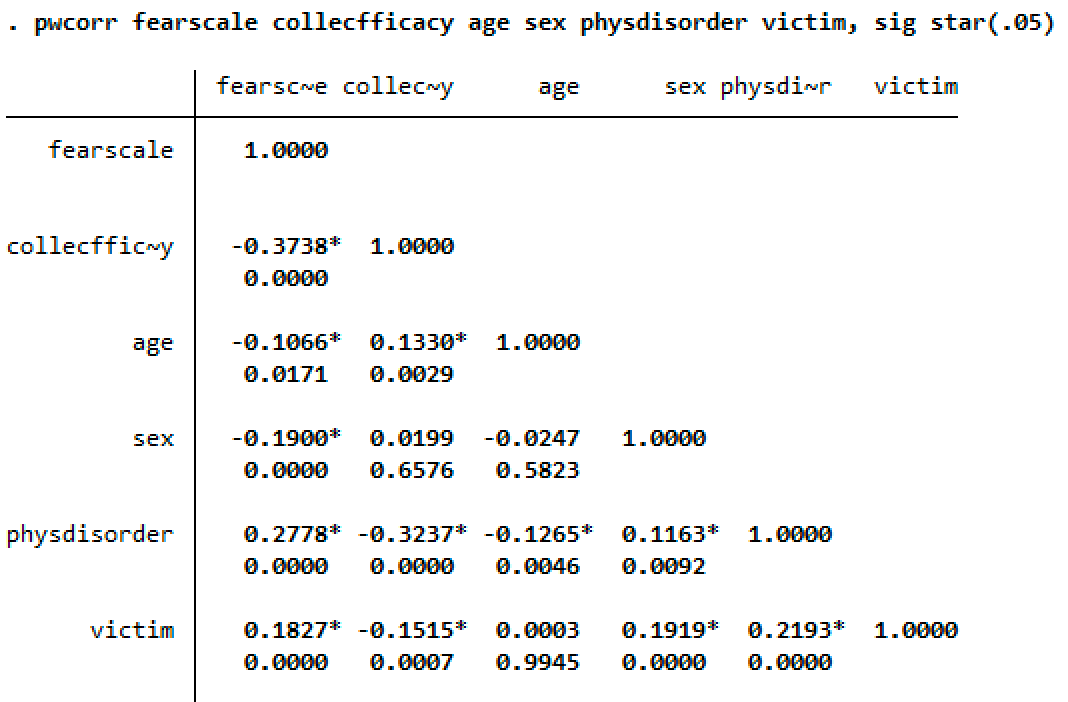
Step by Step Solution

There are 3 Steps involved in it

1 Expert Approved Answer
Step: 1 Unlock blur-text-image
Question Has Been Solved by an Expert!

Get step-by-step solutions from verified subject matter experts

Step: 2 Unlock
Step: 3 Unlock

Students Have Also Explored These Related Mathematics Questions!