

Question: Question 1 Comparative statement data for Bridgeport Company and Indigo Company, two competitors, appear below. All statement of financial position data are as of December
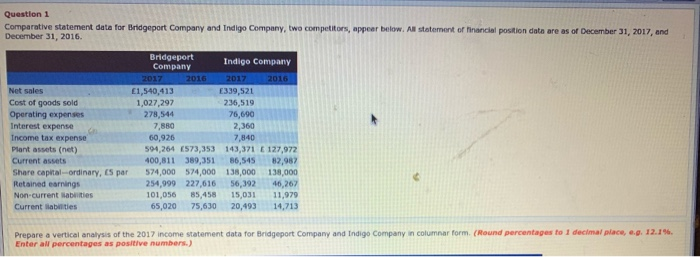
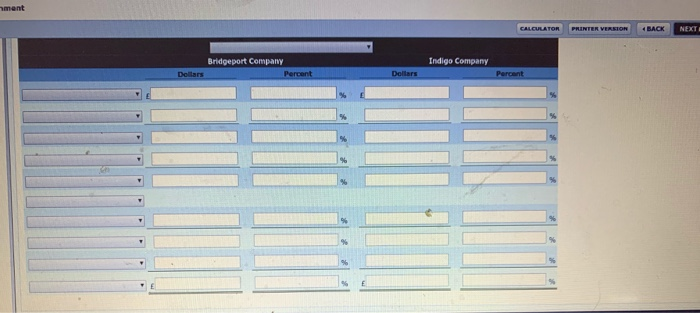
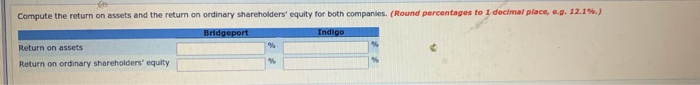
Question 1 Comparative statement data for Bridgeport Company and Indigo Company, two competitors, appear below. All statement of financial position data are as of December 31, 2017, and December 31, 2016 Net sales Cost of goods sold Operating expenses Interest expense Income tax expense Plant assets (net) Current assets Share capital ordinary, 5 par Retained earnings Non-current saties Currenties Bridgeport Company Indigo Company 2017 2016 2017 2016 1,540,413 E339,521 1,027,297 236,519 278,544 76,690 7,850 2,360 60,926 7,840 594,264 (573,353 143,371 127,972 400,811 389,351 86,545 82,982 574,000 574.000 1 .000 138.000 254.999 227,616 56,392 46,267 101,05685,458 15 031 11.979 65 020 75.630 20.493 14,713 (Round percentages to I decimal place, ep. 12.15 Prepare a vertical analysis of the 2017 income statement data for Bridgeport Company and Indigo Company in columnar form Enter a percentages as positive numbers) hment CALCULATOR PRINTER VERSION 4 BACK NEXT Bridgeport Company Indigo Company Dollars Compute the return on assets and the return on ordinary shareholders' equity for both companies. (Round percentages to I decimal place, ... 12.156.) Bridgeport Return on assets Return on ordinary shareholders' equity
Step by Step Solution
There are 3 Steps involved in it

Get step-by-step solutions from verified subject matter experts