

Question: Question 1 - Complete the table below to calculate the Expected Return, Variance, and Standard Deviation for the stocks of Home Depot, Inc (HD) and
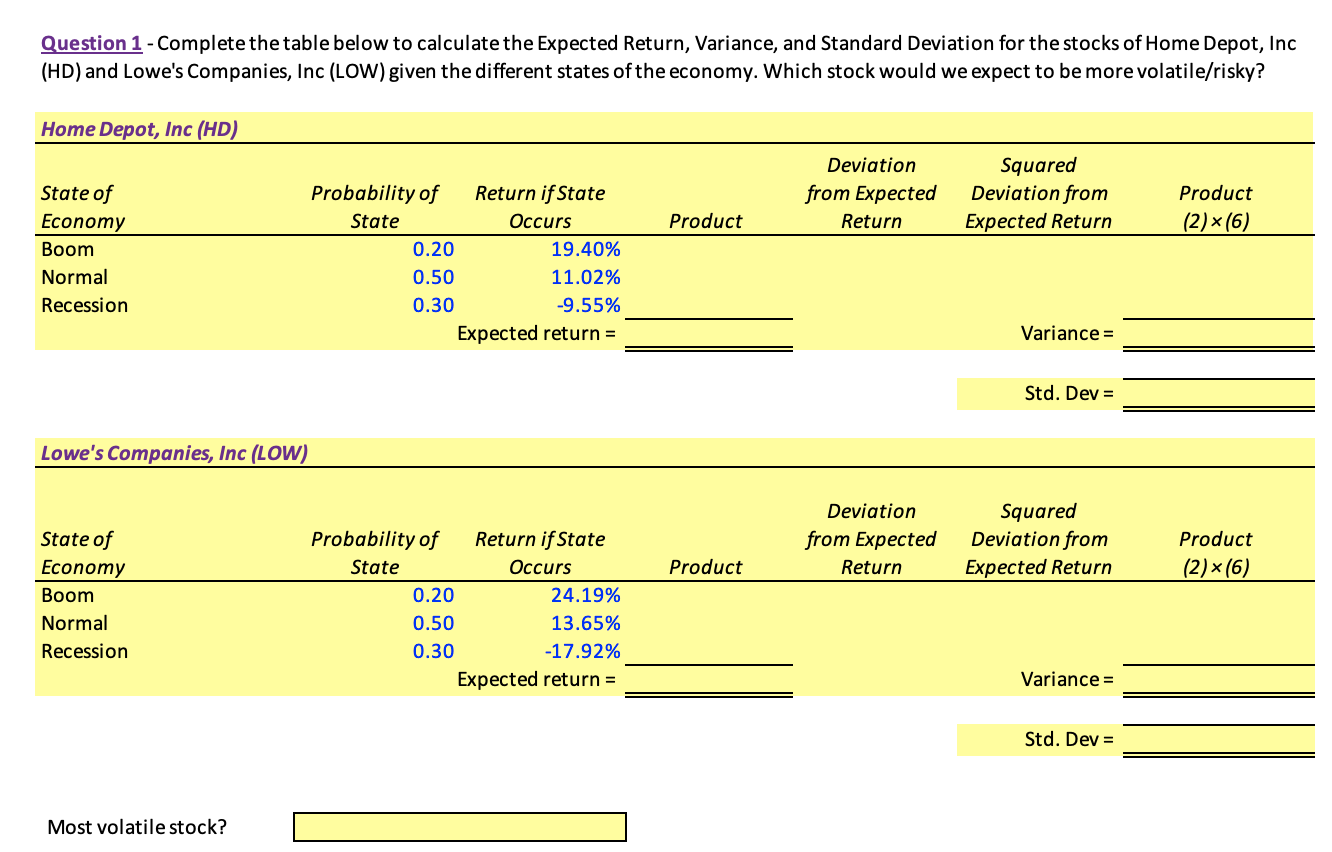
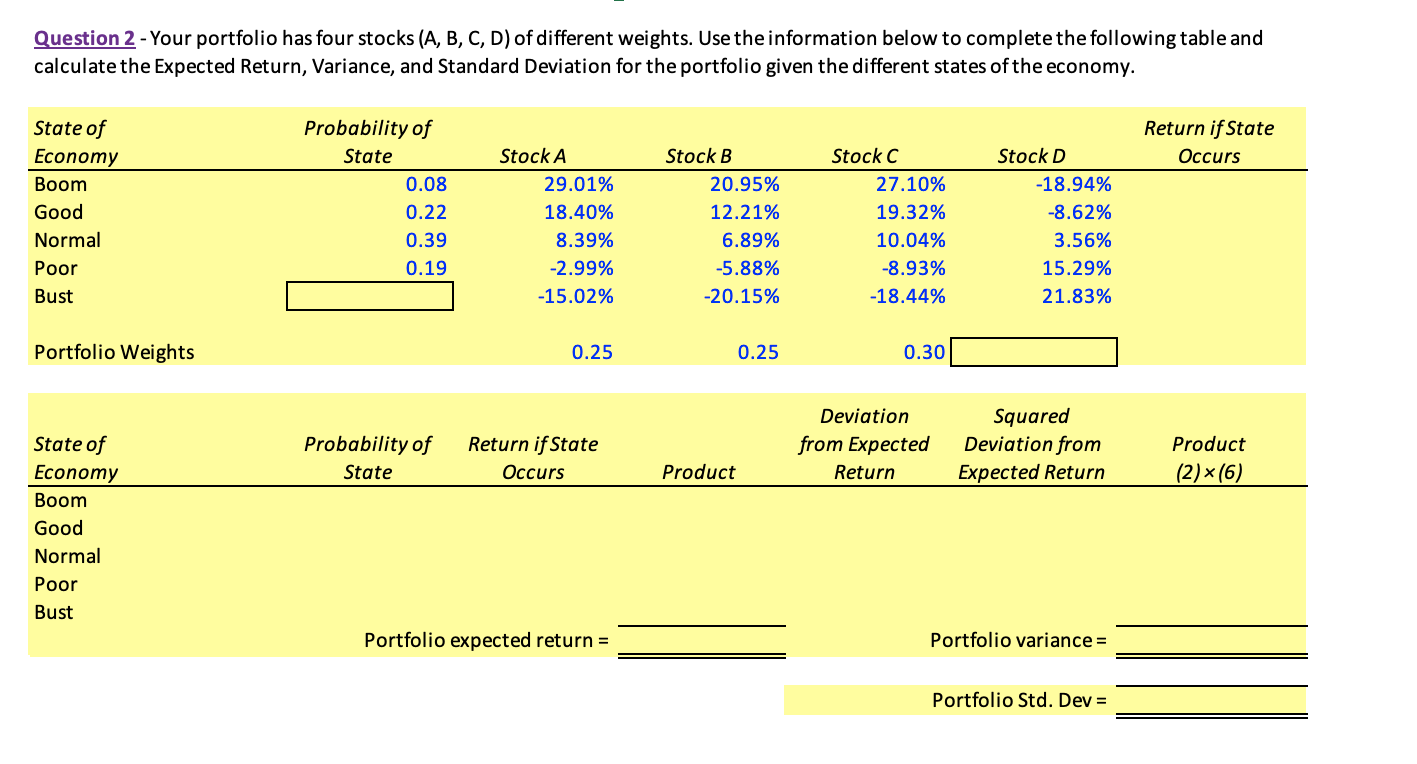
Question 1 - Complete the table below to calculate the Expected Return, Variance, and Standard Deviation for the stocks of Home Depot, Inc (HD) and Lowe's Companies, Inc (LOW) given the different states of the economy. Which stock would we expect to be more volatile/risky? Home Depot, Inc (HD) Deviation Squared State of Probability of Return if State from Expected Deviation from Product Economy State Occurs Product Return Expected Return (2) x (6) Boom 0.20 19.40% Normal 0.50 11.02% Recession 0.30 -9.55% Expected return = Variance = Std. Dev = Lowe's Companies, Inc (LOW) Deviation Squared State of Probability of Return if State from Expected Deviation from Product Economy State Occurs Product Return Expected Return (2) x (6) Boom 0.20 24.19% Normal 0.50 13.65% Recession 0.30 -17.92% Expected return = Variance = Std. Dev = Most volatile stock?Question 2 - Your portfolio has four stocks (A, B, C, D) of different weights. Use the information below to complete the following table and calculate the Expected Return, Variance, and Standard Deviation for the portfolio given the different states of the economy. State of Probability of Return if State Economy State Stock A Stock B Stock C Stock D Occurs Boom 0.08 29.01% 20.95% 27.10% 18.94% Good 0.22 18.40% 12.21% 19.32% -8.62% Normal 0.39 8.39% 6.89% 10.04% 3.56% Poor 0.19 -2.99% -5.88% -8.93% 15.29% Bust -15.02% -20.15% -18.44% 21.83% Portfolio Weights 0.25 0.25 0.30 Deviation Squared State of Probability of Return if State from Expected Deviation from Product Economy State Occurs Product Return Expected Return (2) x (6) Boom Good Normal Poor Bust Portfolio expected return = Portfolio variance = Portfolio Std. Dev =
Step by Step Solution
There are 3 Steps involved in it

Get step-by-step solutions from verified subject matter experts