

Question: Question 1 Interpret the coefficient of correlation using the table below? SUMMARY OUTPUT Regression Statistics Multiple R R Square Adjusted R Square Standard Error
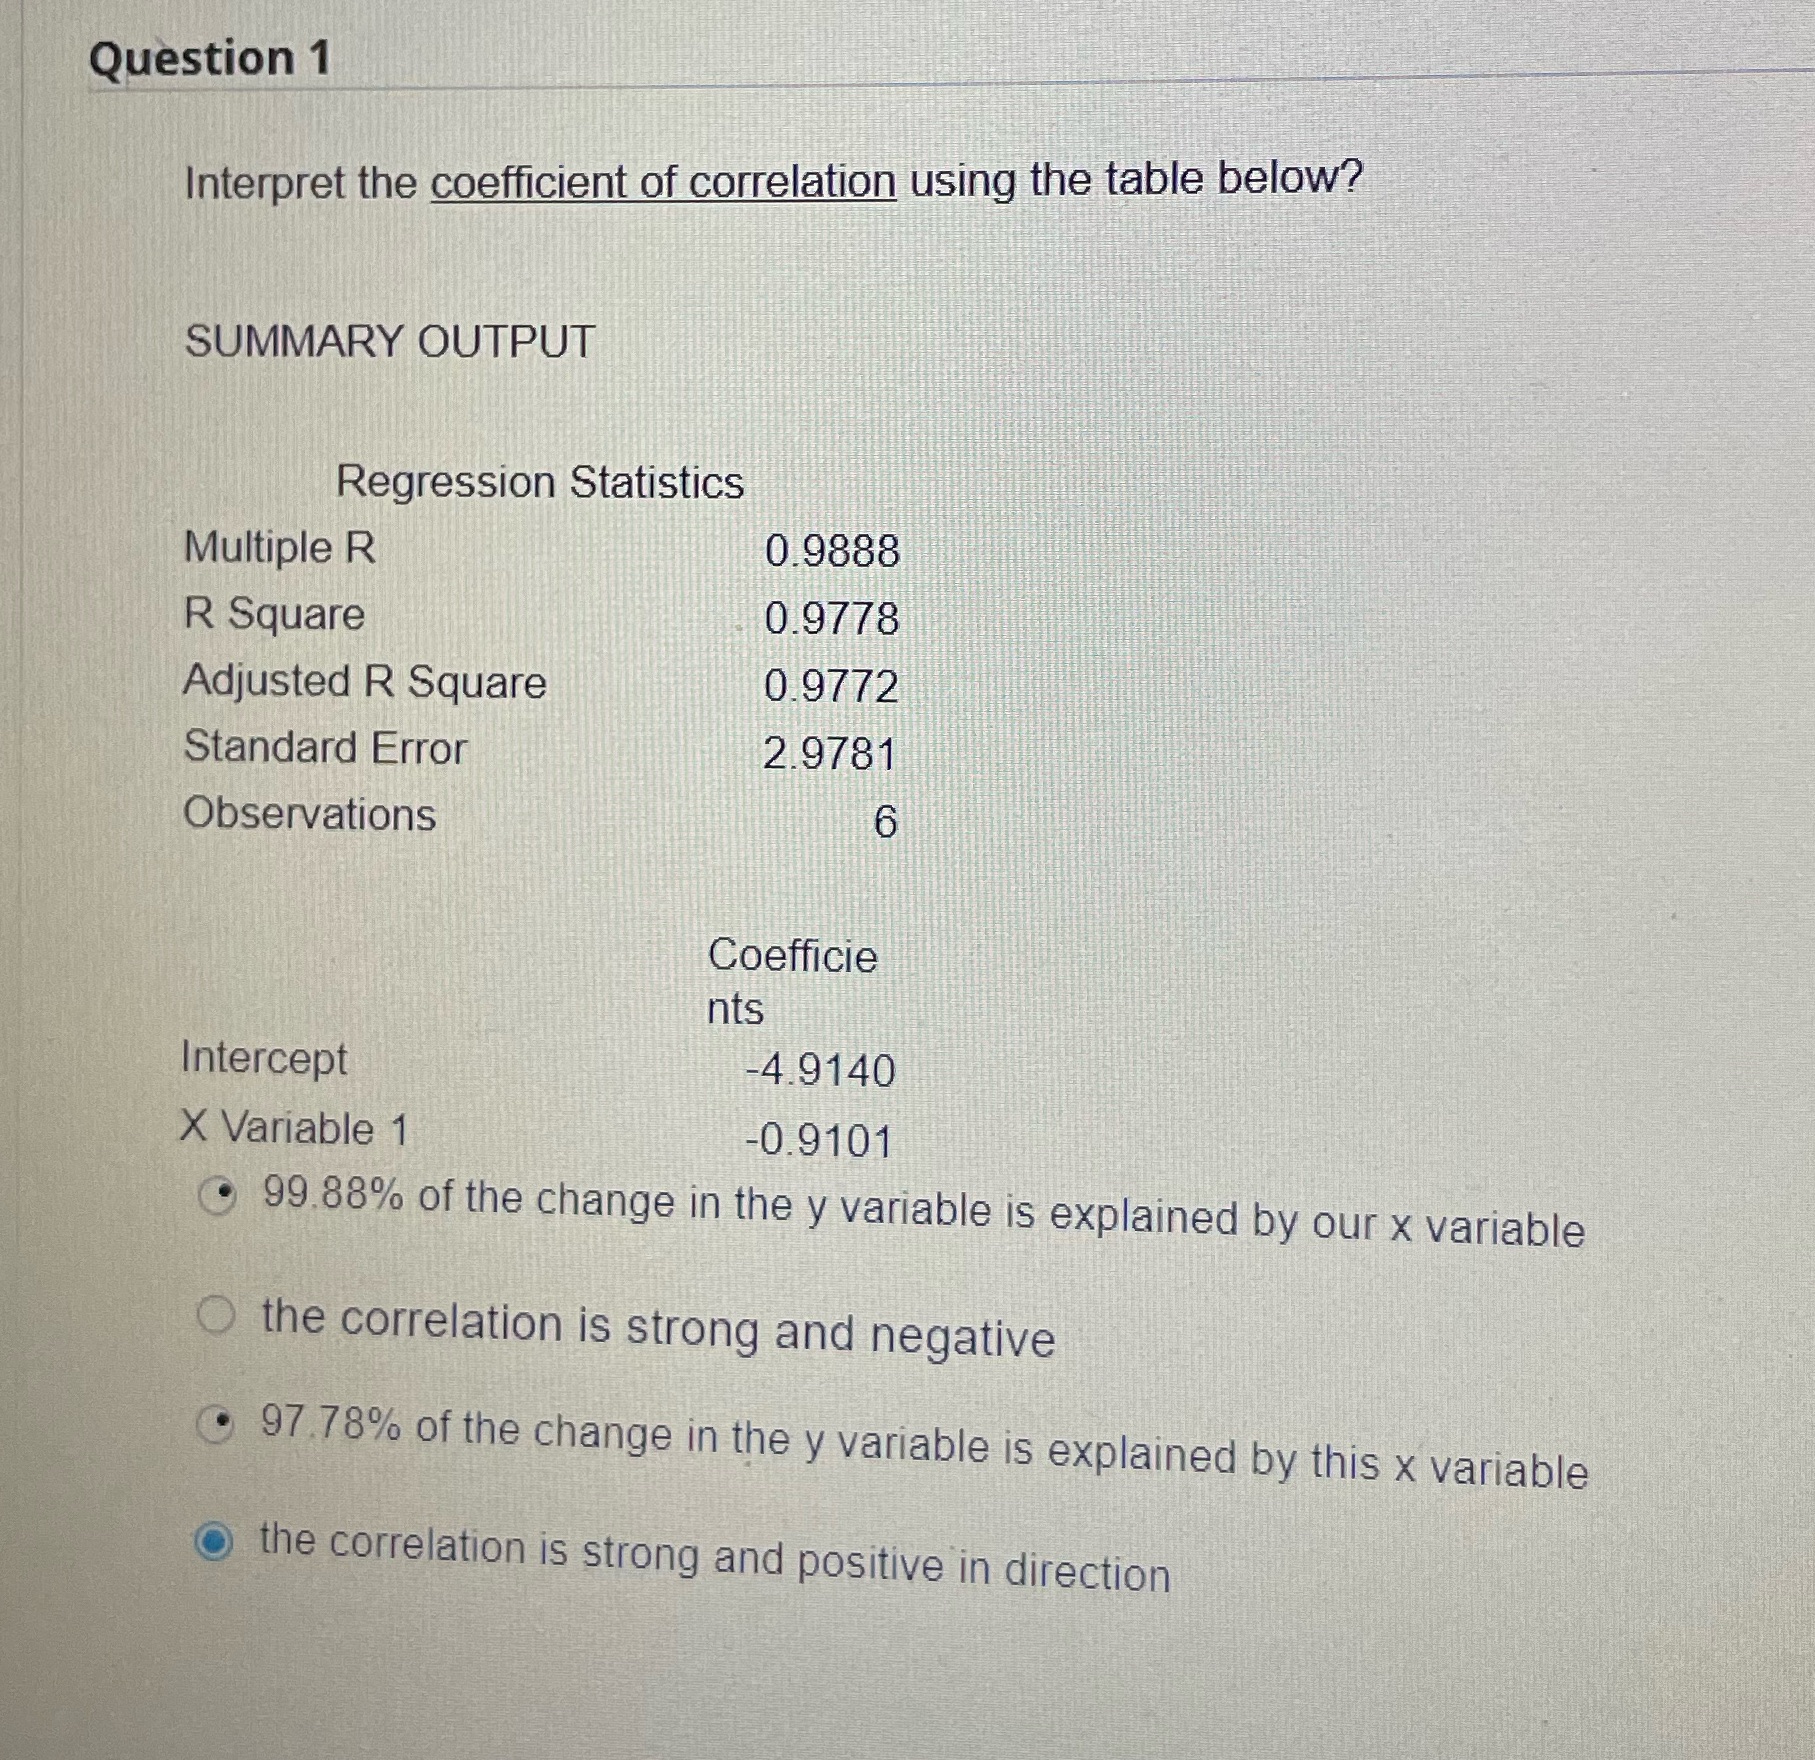
Question 1 Interpret the coefficient of correlation using the table below? SUMMARY OUTPUT Regression Statistics Multiple R R Square Adjusted R Square Standard Error Observations 0.9888 0.9778 0.9772 2.9781 6 Coefficie nts Intercept -4.9140 X Variable 1 -0.9101 99.88% of the change in the y variable is explained by our x variable O the correlation is strong and negative 97.78% of the change in the y variable is explained by this x variable the correlation is strong and positive in direction
Step by Step Solution
3.34 Rating (151 Votes )
There are 3 Steps involved in it
The detailed answer for the above question is provided below Based on the table t... View full answer

Get step-by-step solutions from verified subject matter experts