

Question: need answer Interpret the coefficient of correlation using the table below? SUMMARY OUTPUT Regression Statistics Multiple R 0.9902 R Square 0.9805 Adjusted R Square 0.9711
need answer
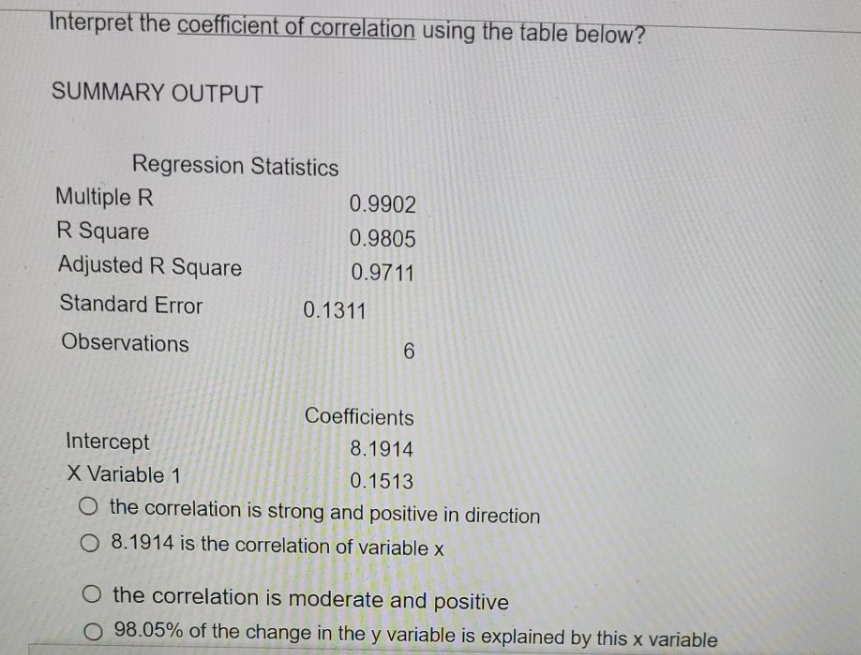
Interpret the coefficient of correlation using the table below? SUMMARY OUTPUT Regression Statistics Multiple R 0.9902 R Square 0.9805 Adjusted R Square 0.9711 Standard Error 0.1311 Observations 6 Coefficients Intercept 8.1914 X Variable 1 0.1513 O the correlation is strong and positive in direction O 8.1914 is the correlation of variable x O the correlation is moderate and positive 98.05% of the change in the y variable is explained by this x variable
Step by Step Solution
There are 3 Steps involved in it
1 Expert Approved Answer
Step: 1 Unlock

Question Has Been Solved by an Expert!
Get step-by-step solutions from verified subject matter experts
Step: 2 Unlock
Step: 3 Unlock