

Question: Question Completion Status: Interpret the coefficient of determination using the table below? SUMMARY OUTPUT Regression Statistics Multiple R 0.9818 R Square 0.9639 Adjusted R Square
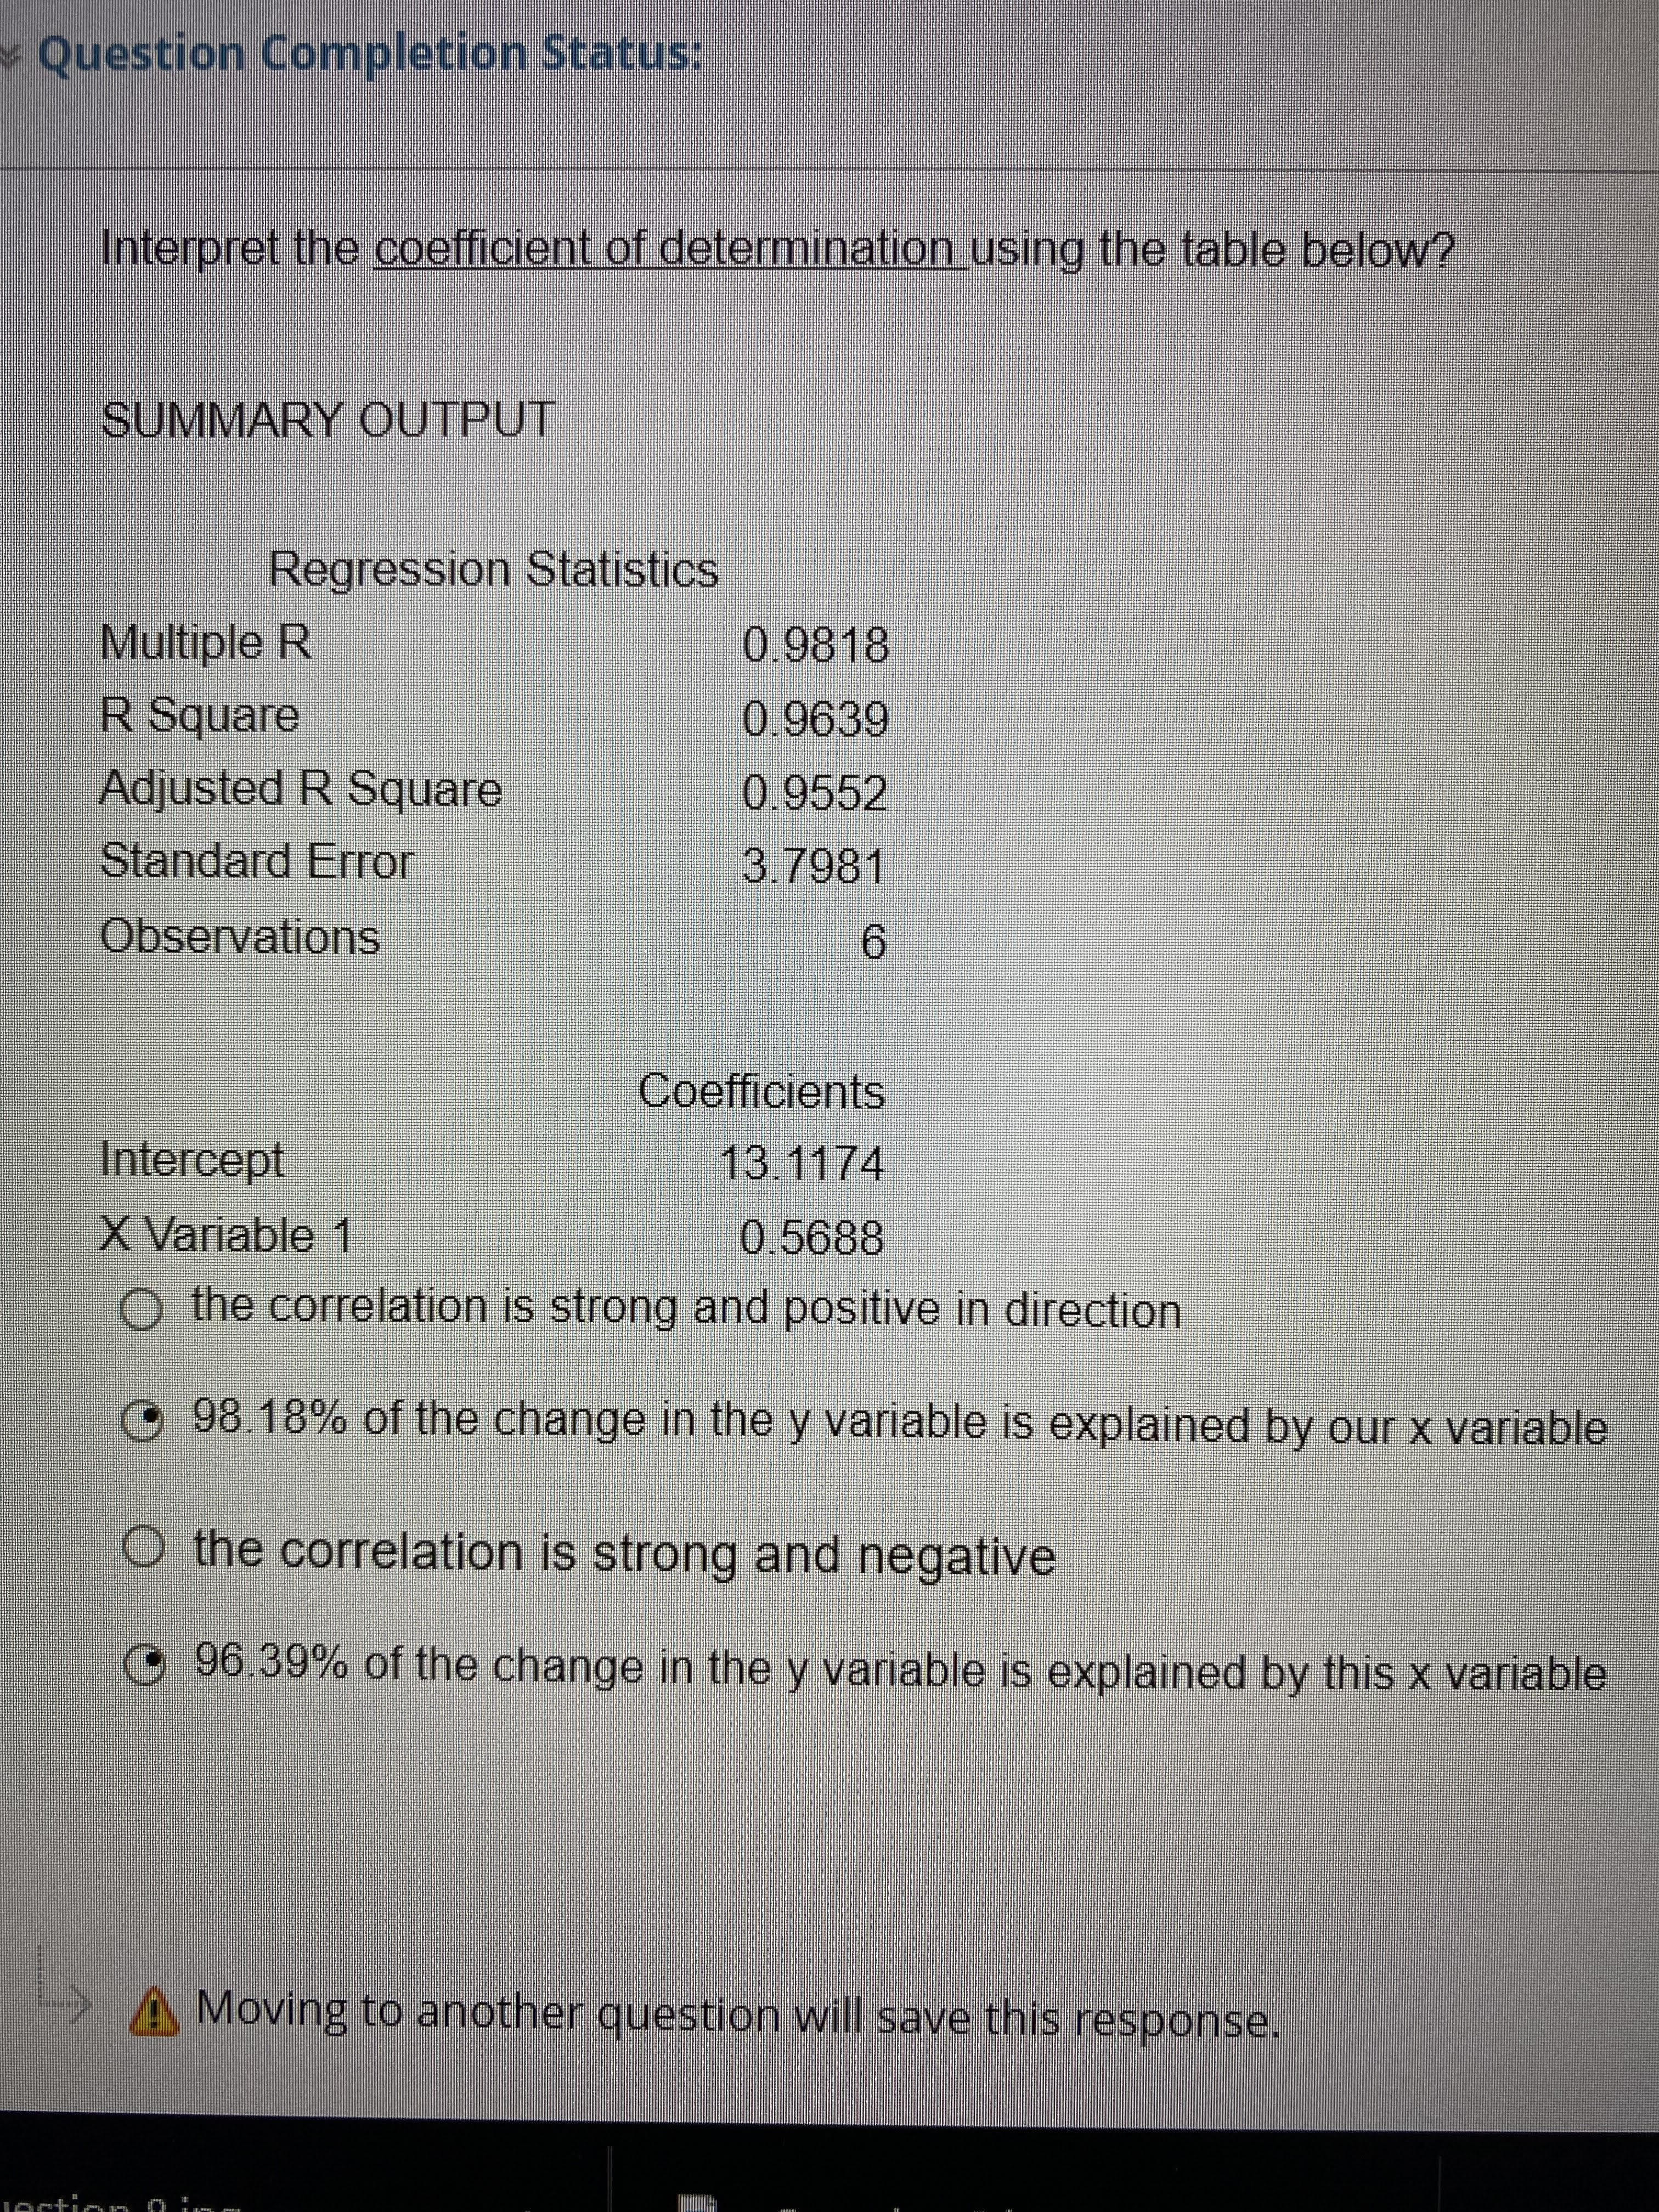

Question Completion Status: Interpret the coefficient of determination using the table below? SUMMARY OUTPUT Regression Statistics Multiple R 0.9818 R Square 0.9639 Adjusted R Square 0.9552 Standard Error 3.7981 Observations 6 Coefficients Intercept 13. 1174 X Variable 1 0.5688 the correlation is strong and positive in direction 98.18% of the change in the y variable is explained by our x variable O the correlation is strong and negative 96.39% of the change in the y variable is explained by this x variable Moving to another question will save this response
Step by Step Solution
There are 3 Steps involved in it
1 Expert Approved Answer
Step: 1 Unlock

Question Has Been Solved by an Expert!
Get step-by-step solutions from verified subject matter experts
Step: 2 Unlock
Step: 3 Unlock