

Question: question 1: part A question 2: part A question 3: part A question 4: part A question 5: part A question 6: part A question
question 1: part A
question 2: part A
question 3: part A
question 4: part A
question 5: part A
question 6: part A
question 7: part A
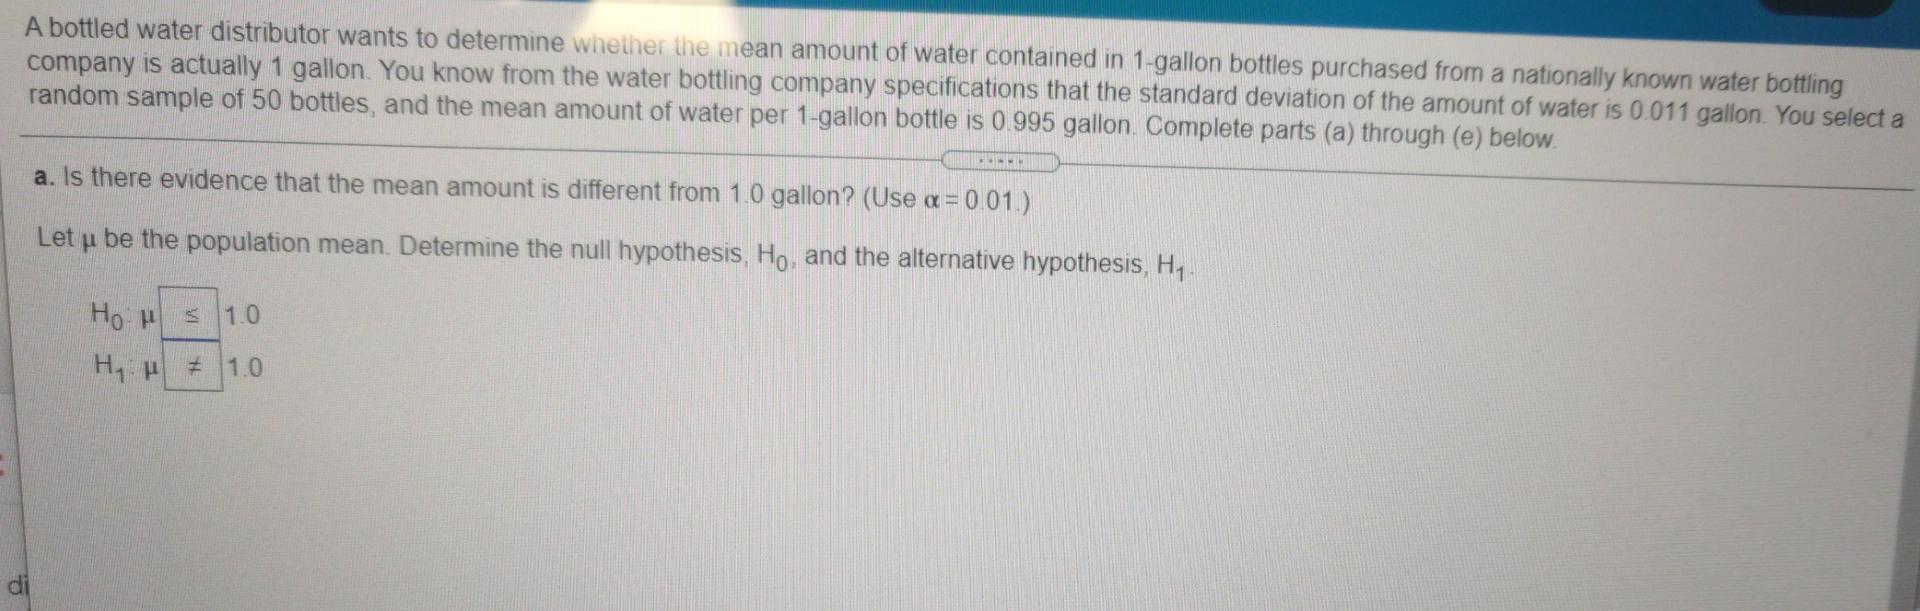
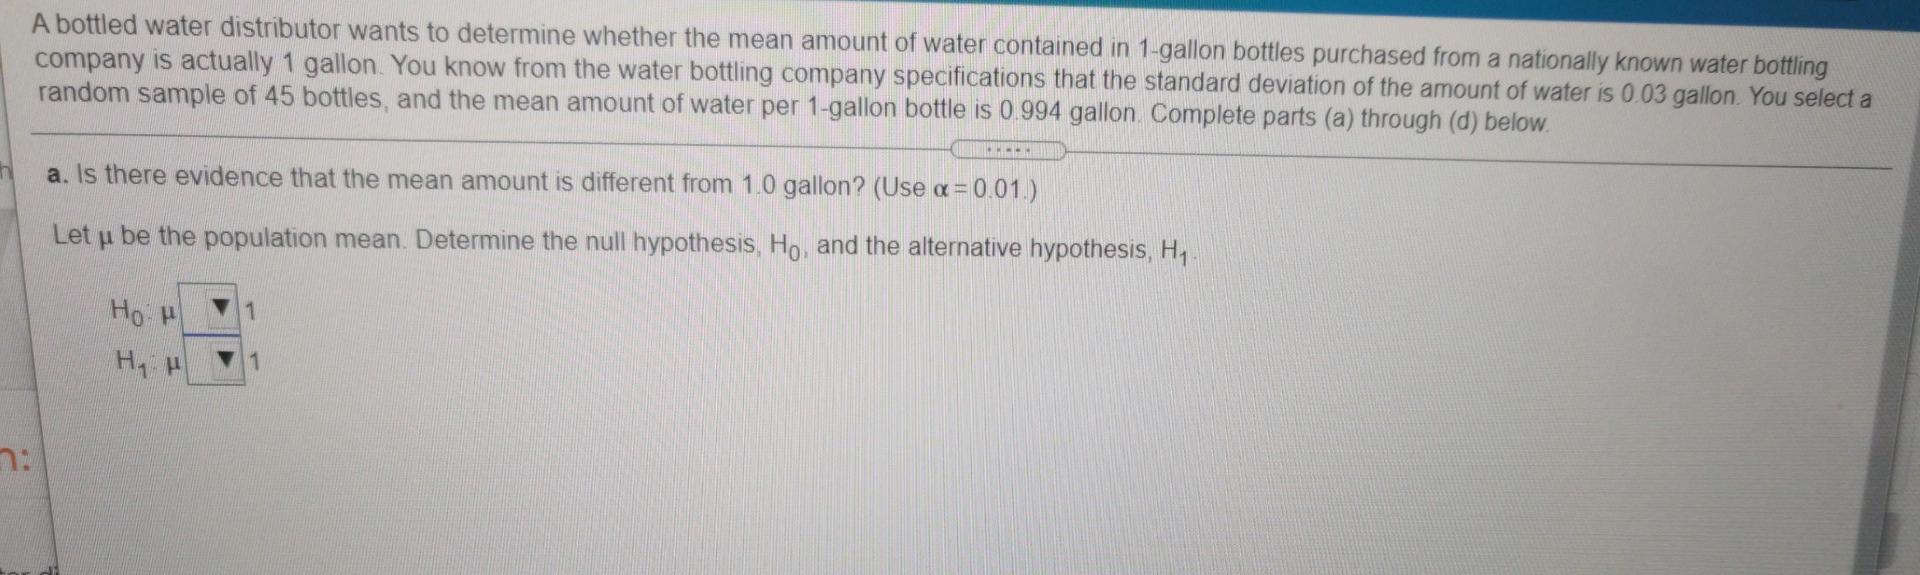
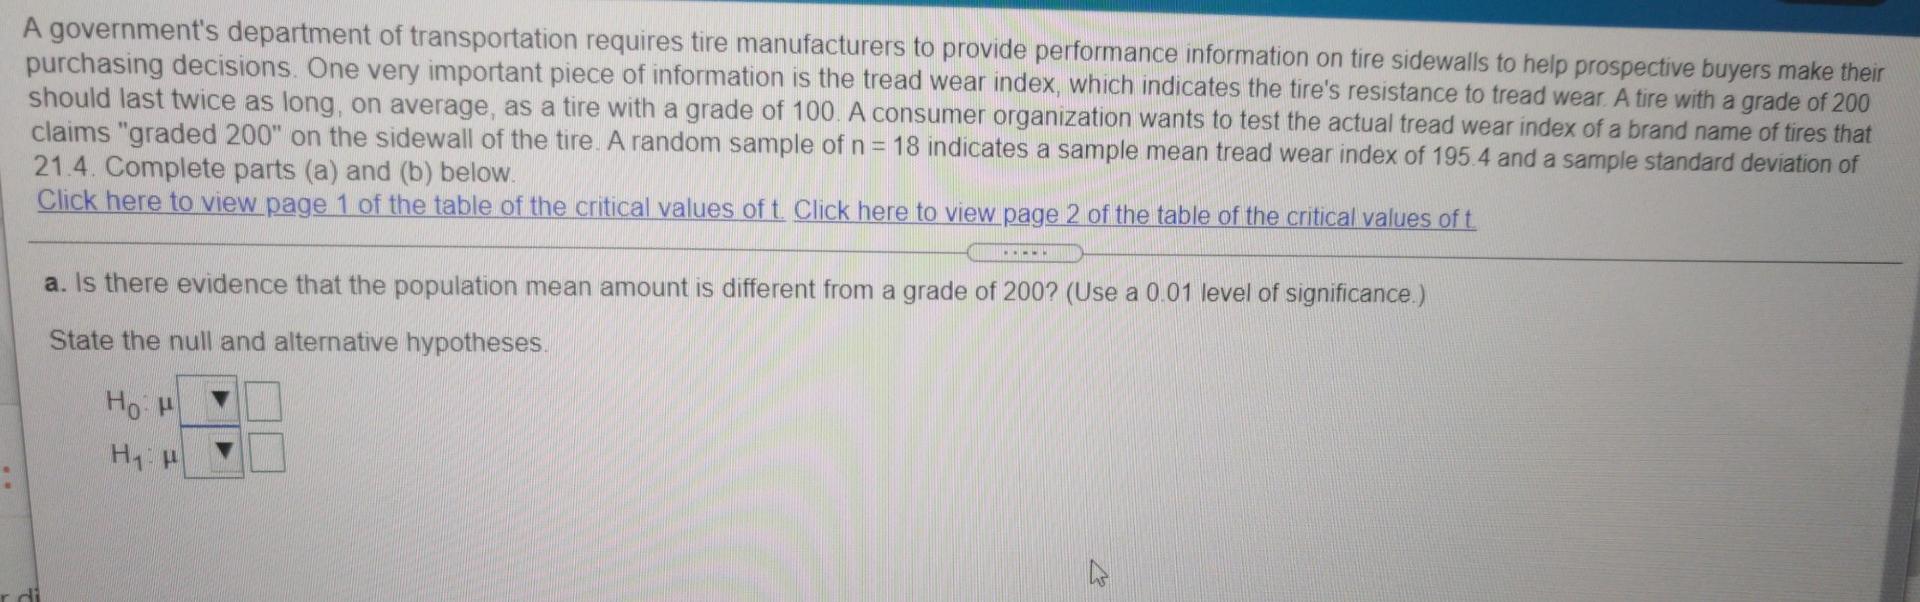
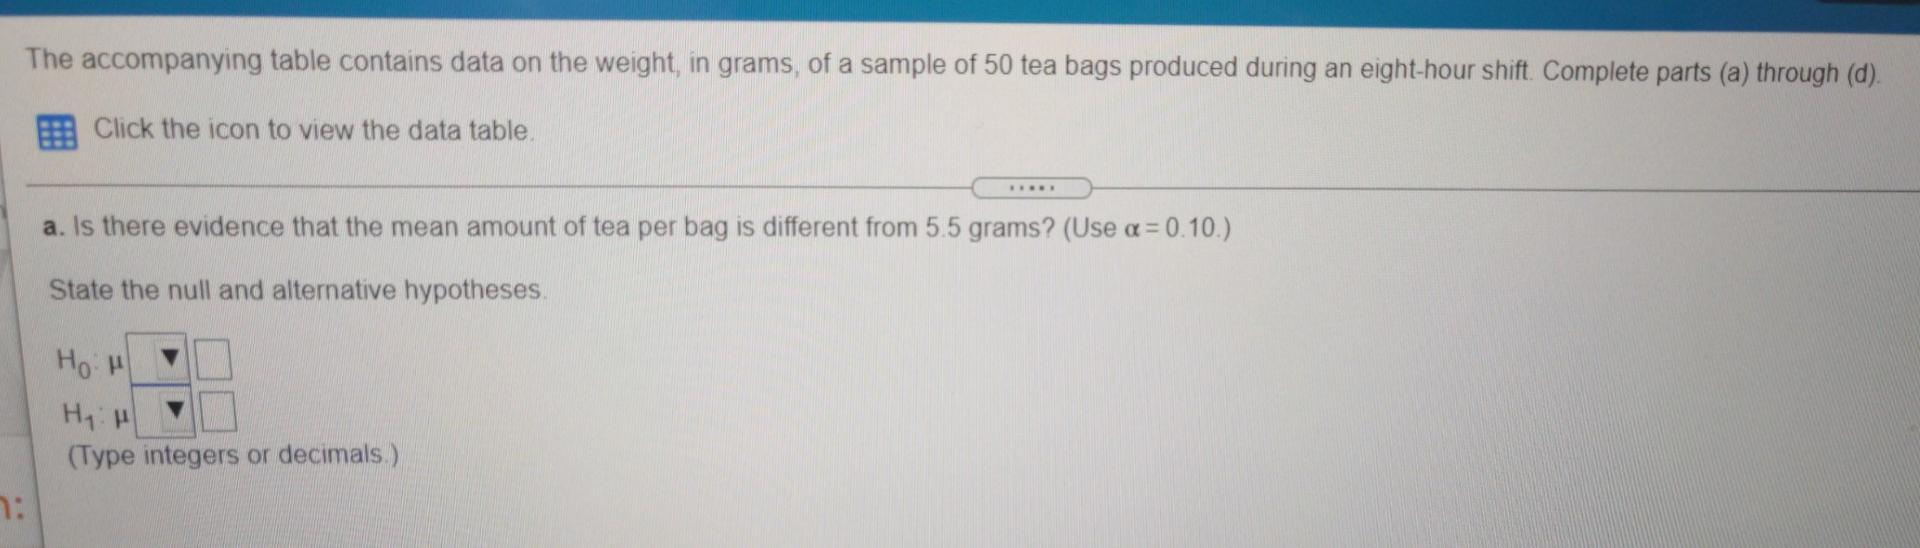
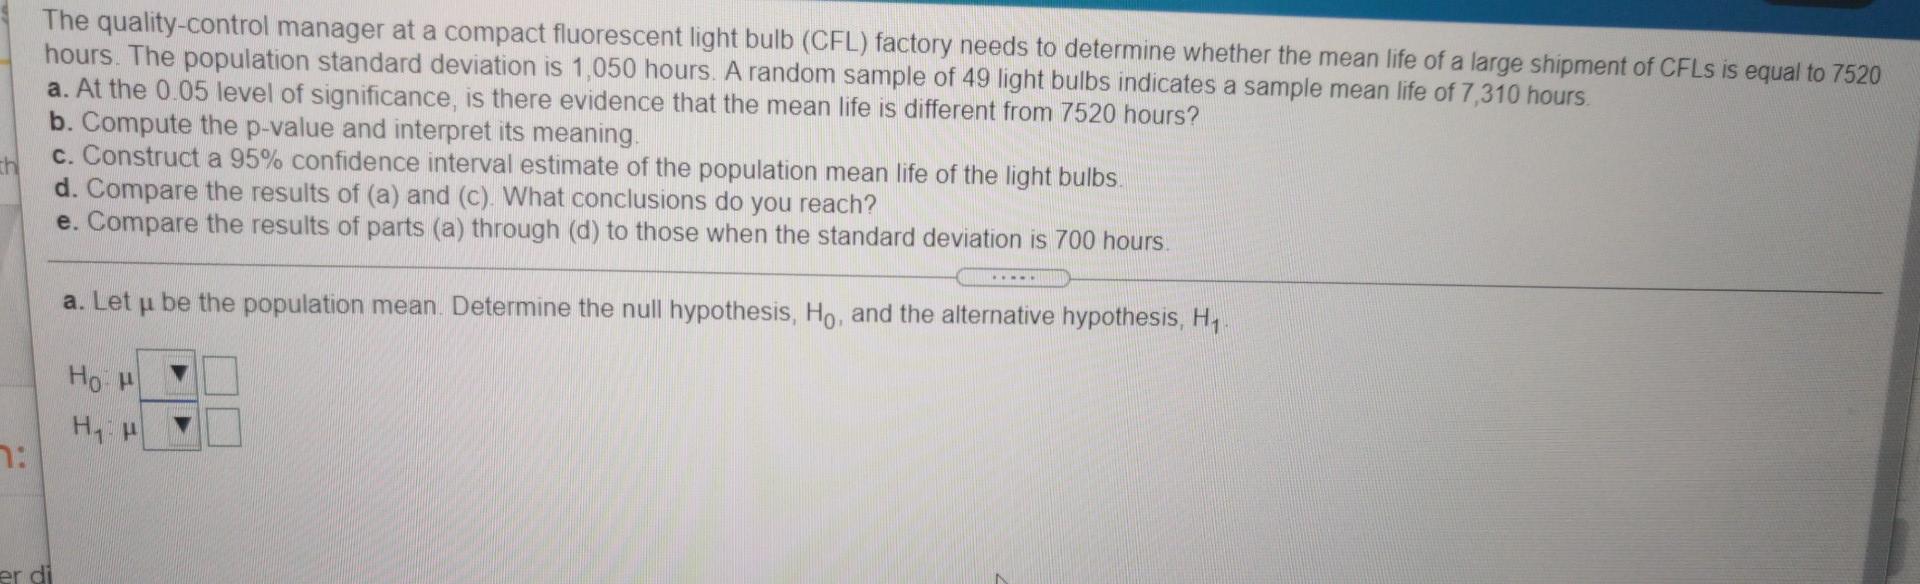
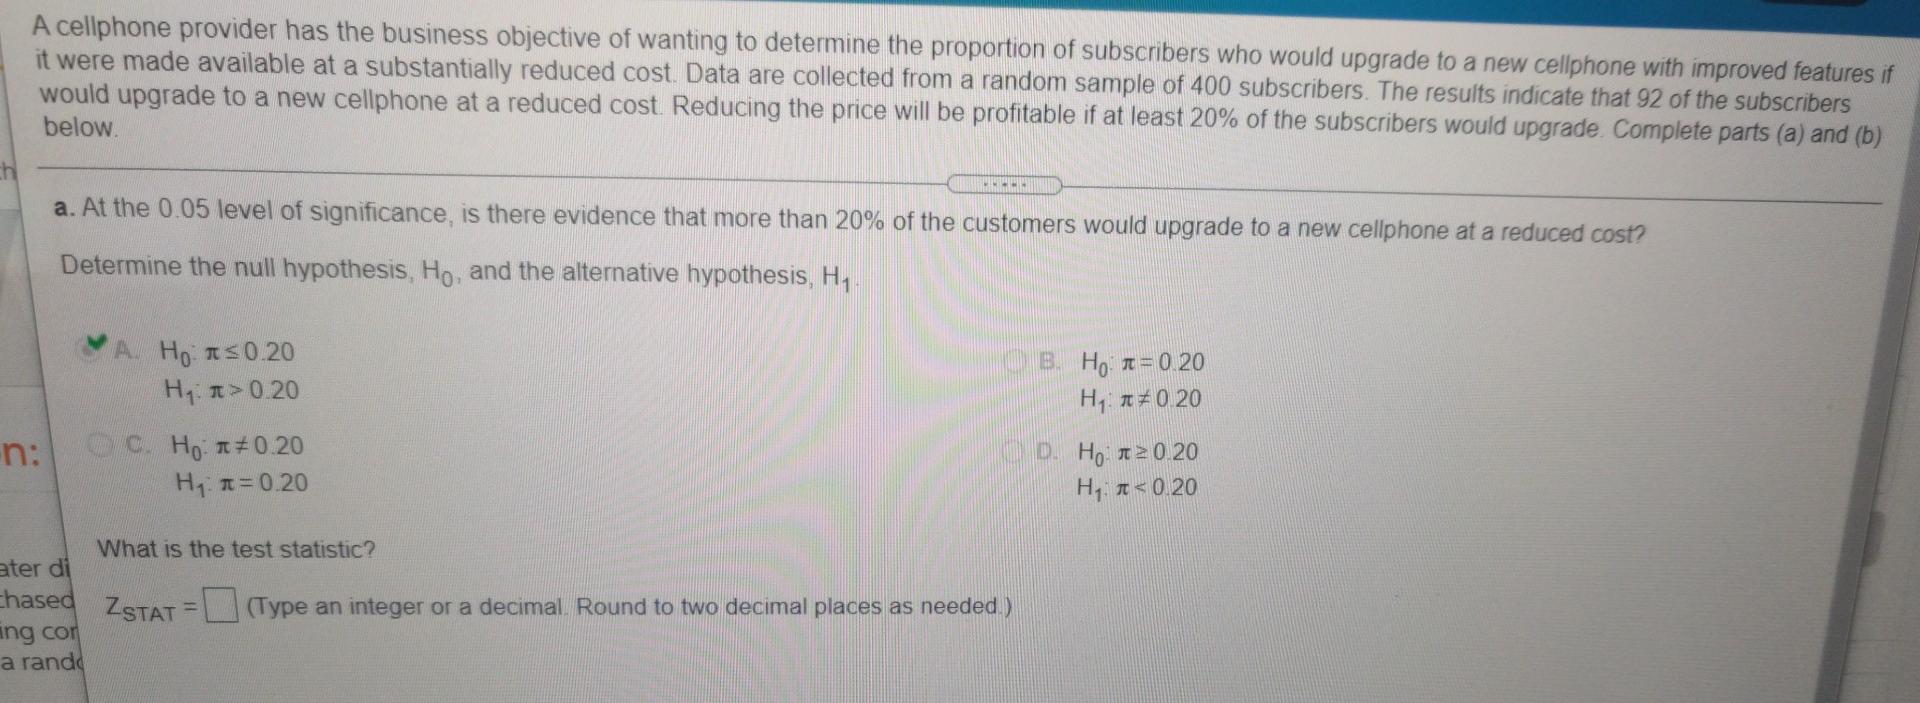
A bottled water distributor wants to determine whether the mean amount of water contained in 1-gallon bottles purchased from a nationally known water bottling company is actually 1 gallon. You know from the water bottling company specifications that the standard deviation of the amount of water is 0.011 gallon. You select a random sample of 50 bottles, and the mean amount of water per 1-gallon bottle is 0.995 gallon. Complete parts (a) through (e) below a. Is there evidence that the mean amount is different from 1.0 gallon? (Use a =0.01.) Let u be the population mean. Determine the null hypothesis, Ho, and the alternative hypothesis, Hi- Hop $ 1.0 Hp * 1.0 di A bottled water distributor wants to determine whether the mean amount of water contained in 1-gallon bottles purchased from a nationally known water bottling company is actually 1 gallon. You know from the water bottling company specifications that the standard deviation of the amount of water is 0.03 gallon. You select a random sample of 45 bottles, and the mean amount of water per 1-gallon bottle is 0.994 gallon Complete parts (a) through (d) below. a. Is there evidence that the mean amount is different from 1.0 gallon? (Use a = 0.01.) Let u be the population mean. Determine the null hypothesis, Ho, and the alternative hypothesis, H7 Hop 1 n: A government's department of transportation requires tire manufacturers to provide performance information on tire sidewalls to help prospective buyers make their purchasing decisions. One very important piece of information is the tread wear index, which indicates the tire's resistance to tread wear. A tire with a grade of 200 should last twice as long, on average as a tire with a grade of 100. A consumer organization wants to test the actual tread wear index of a brand name of tires that claims "graded 200" on the sidewall of the tire. A random sample of n = 18 indicates a sample mean tread wear index of 195.4 and a sample standard deviation of 21.4. Complete parts (a) and (b) below. Click here to view page 1 of the table of the critical values of t. Click here to view page 2 of the table of the critical values oft . a. Is there evidence that the population mean amount is different from a grade of 200? (Use a 0.01 level of significance.) State the null and alternative hypotheses. 4 The accompanying table contains data on the weight, in grams, of a sample of 50 tea bags produced during an eight-hour shift Complete parts (a) through (d). B Click the icon to view the data table. a. Is there evidence that the mean amount of tea per bag is different from 5.5 grams? (Use a=0.10.) State the null and alternative hypotheses. H:H (Type integers or decimals.) 7: The quality-control manager at a compact fluorescent light bulb (CFL) factory needs to determine whether the mean life of a large shipment of CFLs is equal to 7520 hours. The population standard deviation is 1,050 hours. A random sample of 49 light bulbs indicates a sample mean life of 7,310 hours. a. At the 0.05 level of significance, is there evidence that the mean life is different from 7520 hours? b. Compute the p-value and interpret its meaning. c. Construct a 95% confidence interval estimate of the population mean life of the light bulbs. d. Compare the results of (a) and (c). What conclusions do you reach? e. Compare the results of parts (a) through (d) to those when the standard deviation is 700 hours. a. Let u be the population mean. Determine the null hypothesis, Ho, and the alternative hypothesis, Hy Hot H, H 1: er di A cellphone provider has the business objective of wanting to determine the proportion of subscribers who would upgrade to a new cellphone with improved features if it were made available at a substantially reduced cost. Data are collected from a random sample of 400 subscribers. The results indicate that 92 of the subscribers would upgrade to a new cellphone at a reduced cost Reducing the price will be profitable if at least 20% of the subscribers would upgrade. Complete parts (a) and (b) below. a. At the 0.05 level of significance, is there evidence that more than 20% of the customers would upgrade to a new cellphone at a reduced cost? Determine the null hypothesis, Ho, and the alternative hypothesis, H1 B. Ho 1 = 0.20 Hy: 130 20 A Ho: 30.20 Hq. t>0.20 C. Ho 1+0.20 Hy=0.20 n: D. HO 120.20 Hy: 10.36 OB. Ho: 120.36, H, 1
Step by Step Solution
There are 3 Steps involved in it

Get step-by-step solutions from verified subject matter experts