

Question: QUESTION 1: QUESTION 2: QUESTION 3: QUESTION 4: Refer to Table 56.1 - Factors for Computing Control Chart Limits (3 sigma) for this problem. Twelve
QUESTION 1:
QUESTION 2:
QUESTION 3:
QUESTION 4:
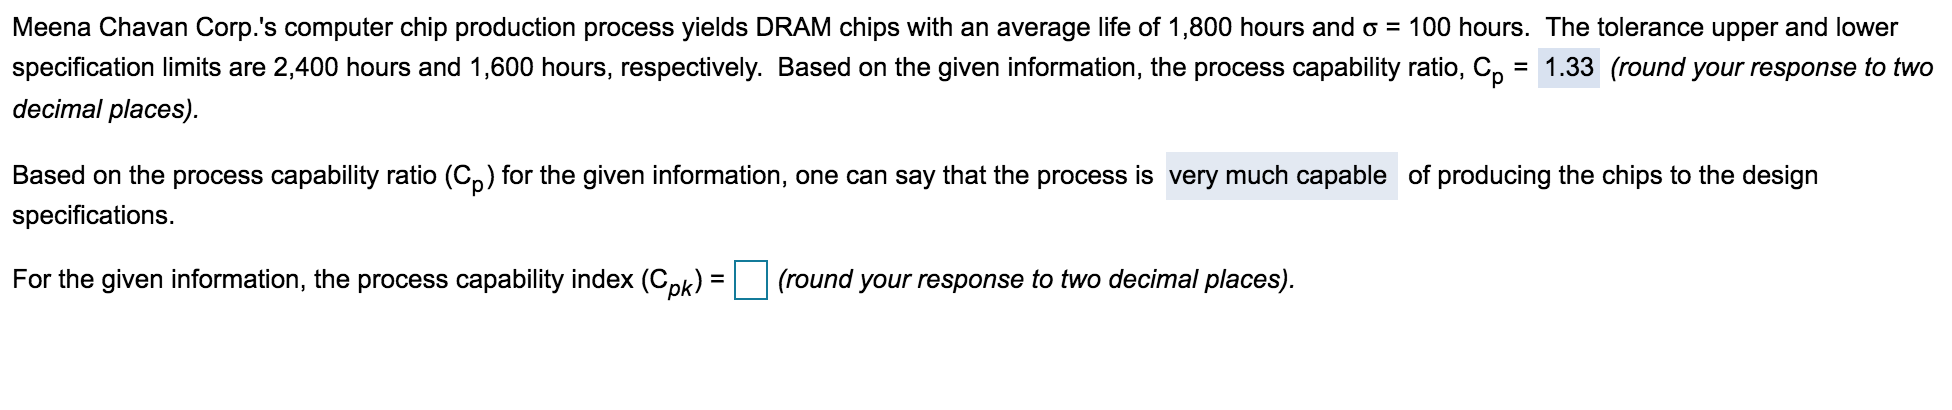
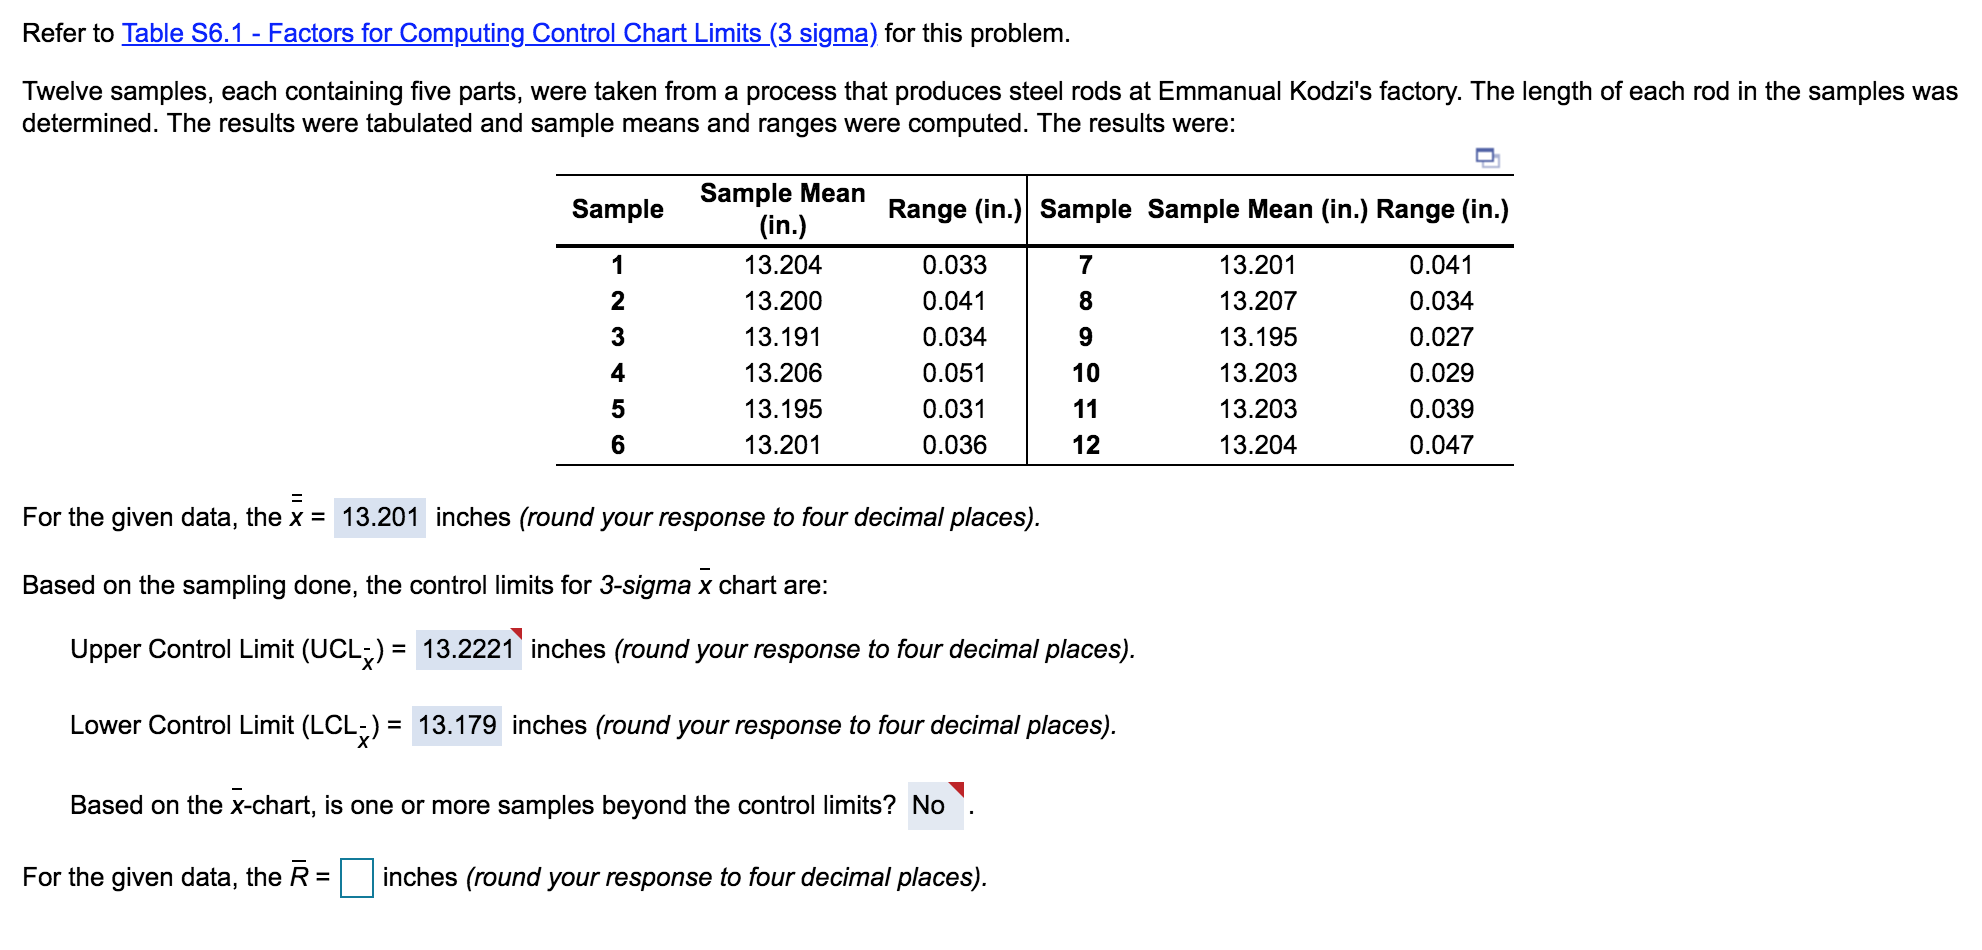
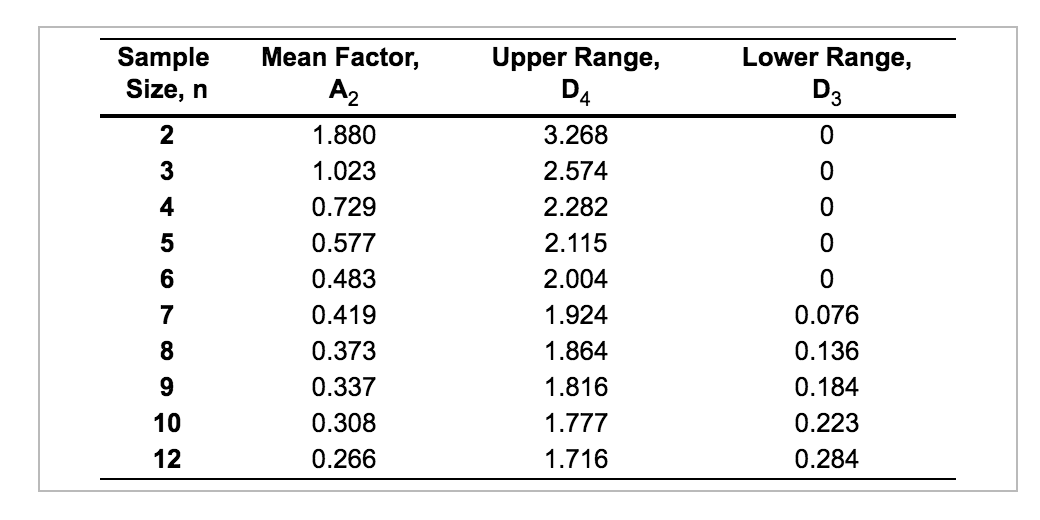
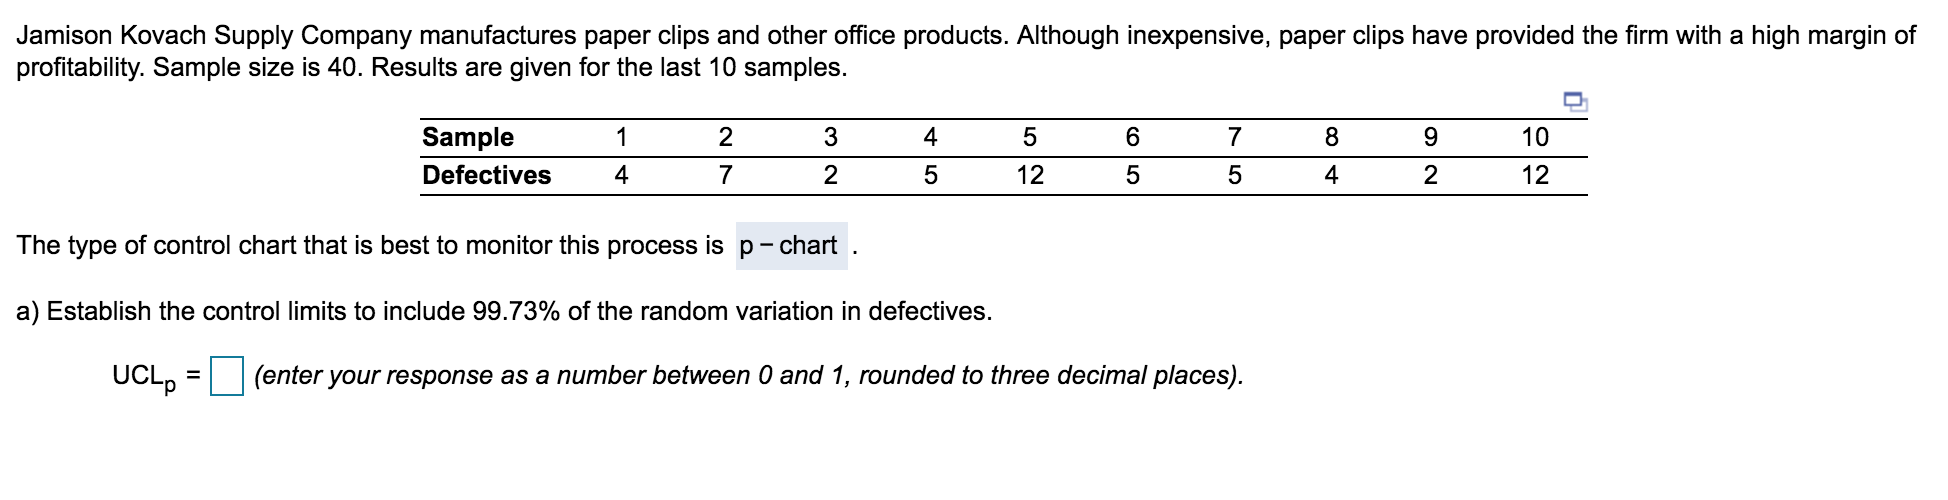
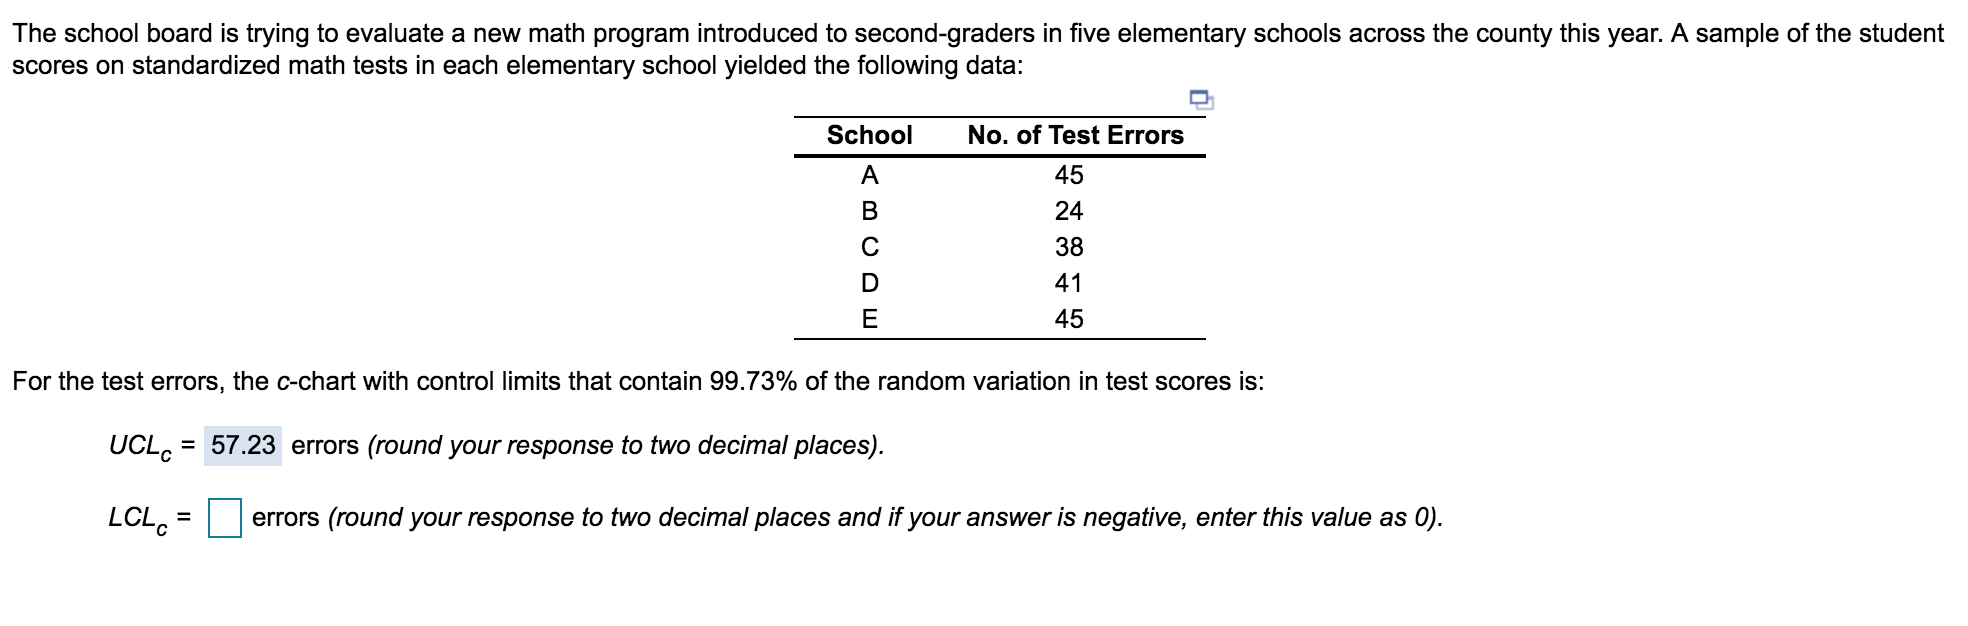
Refer to Table 56.1 - Factors for Computing Control Chart Limits (3 sigma) for this problem. Twelve samples, each containing five parts, were taken from a process that produces steel rods at Emmanual Kodzi's factory. The length of each rod in the samples was determined. The results were tabulated and sample means and ranges were computed. The results were: Sample Range (in.) Sample Sample Mean (in.) Range (in.) 1 7 8 2 3 Sample Mean (in.) 13.204 13.200 13.191 13.206 13.195 13.201 9 0.033 0.041 0.034 0.051 0.031 0.036 13.201 13.207 13.195 13.203 13.203 13.204 0.041 0.034 0.027 0.029 0.039 0.047 4 5 10 11 12 6 For the given data, the x = 13.201 inches (round your response to four decimal places). Based on the sampling done, the control limits for 3-sigma x chart are: Upper Control Limit (UCL;) = 13.2221 inches (round your response to four decimal places). = = Lower Control Limit (LCL;) = 13.179 inches (round your response to four decimal places). Based on the x-chart, is one or more samples beyond the control limits? No For the given data, the = inches (round your response to four decimal places). Sample Size, n Lower Range, D3 2 3 4 5 Mean Factor, A2 1.880 1.023 0.729 0.577 0.483 0.419 0.373 0.337 0.308 0.266 Upper Range, D4 3.268 2.574 2.282 2.115 2.004 1.924 1.864 1.816 1.777 1.716 0 6 7 8 9 0.076 0.136 0.184 0.223 0.284 10 12 Jamison Kovach Supply Company manufactures paper clips and other office products. Although inexpensive, paper clips have provided the firm with a high margin of profitability. Sample size is 40. Results are given for the last 10 samples. 1 3 4 5 6 7 8 9 10 Sample Defectives 2 7 4 2 5 12 5 5 4 2 12 The type of control chart that is best to monitor this process is p-chart . a) Establish the control limits to include 99.73% of the random variation in defectives. UCLP = (enter your response as a number between 0 and 1, rounded to three decimal places). The school board is trying to evaluate a new math program introduced to second-graders in five elementary schools across the county this year. A sample of the student scores on standardized math tests in each elementary school yielded the following data: School No. of Test Errors A B D 45 24 38 41 45 E For the test errors, the c-chart with control limits that contain 99.73% of the random variation in test scores is: UCLC = 57.23 errors (round your response to two decimal places). LCLC = errors (round your response to two decimal places and if your answer is negative, enter this value as 0). Meena Chavan Corp.'s computer chip production process yields DRAM chips with an average life of 1,800 hours and o = 100 hours. The tolerance upper and lower specification limits are 2,400 hours and 1,600 hours, respectively. Based on the given information, the process capability ratio, Cp = 1.33 (round your response to two decimal places). = Based on the process capability ratio (Cp) for the given information, one can say that the process is very much capable of producing the chips to the design specifications. For the given information, the process capability index (Cpk) = (round your response to two decimal places)
Step by Step Solution
There are 3 Steps involved in it
1 Expert Approved Answer
Step: 1 Unlock

Question Has Been Solved by an Expert!
Get step-by-step solutions from verified subject matter experts
Step: 2 Unlock
Step: 3 Unlock