

Question: Question 1 Question 2 Question 3 Years 1989 1990 1991 1992 1993 Assets Current Assets Cash Accounts Receivable Inventories Other Current Assets 422 3626 5162
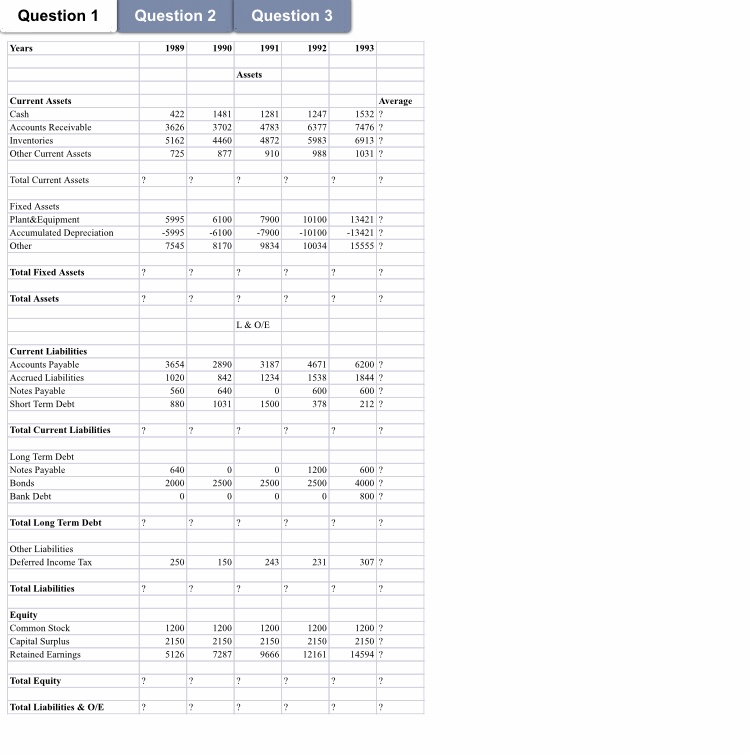
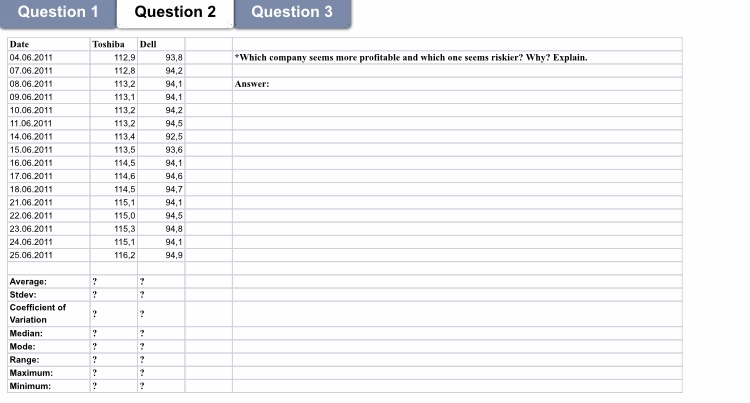
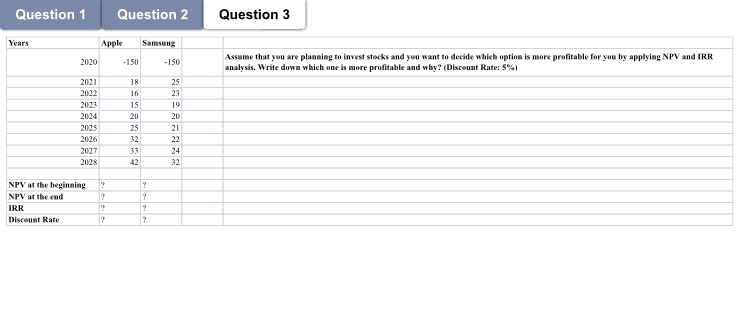
Question 1 Question 2 Question 3 Years 1989 1990 1991 1992 1993 Assets Current Assets Cash Accounts Receivable Inventories Other Current Assets 422 3626 5162 725 1481 3702 4460 877 1281 4783 4872 910 1247 6377 5983 988 Average 15322 7476? 6913? 10312 Total Current Assets ? ? ? ? ? Fixed Assets Plant&Equipment Accumulated Depreciation Other 5995 -5995 7545 6100 -6100 8170 7900 -7900 9834 10100 -10100 10034 134212 -13421 ? 15555 ? Total Fixed Assets ? ? ? ? ? ? Total Assets ? ? ? 2 ? 2 L&O/E Current Liabilities Accounts Payable Accrued Liabilities Notes Payable Short Term Debt 2890 842 4671 1538 3654 1020 560 880 3187 1234 0 1500 6200 18442 600? 212? 640 1031 378 Total Current Liabilities ? ? ? 2 ? ? 0 Long Term Debt Notes Payable Bonds Bank Debt 640 2010 0 0 2500 0 2500 0 1200 2500) 0 600 ? 4000? 800? Total Long Term Debt ? ? ? ? 2 Other Liabilities Deferred Income Tax 250 150 243 231 307? Total Liabilities ? ? ? 2 ? ? Equity Common Stock Capital Surplus Retained Earings 1200 2150 5126 1200 2150 7287 1200 2150 9666 1200 2150 12161 1200 2150? 145942 Total Equity ? ? 2 ? ? Total Liabilities & O/E ? ? ? ? ? ? Question 1 Question 2 Question 3 Dell *Which company seems more profitable and which one seems riskier? Why? Explain. Answer: Date 04.06.2011 07.06.2011 08.06.2011 09.06.2011 10.06.2011 11.06.2011 14.06.2011 15.06.2011 16.06.2011 17.06.2011 18.06.2011 21.06.2011 22.06.2011 23.06.2011 24.06.2011 25.06.2011 Toshiba 112,9 112,8 113,2 113,1 113,2 113.2 113,4 113,5 114,5 114,6 114,5 115,1 115,0 115,3 115,1 116,2 93,8 94,2 94,1 94,1 94,2 94,5 92,5 93,6 94,1 94,6 94,7 94,1 94,5 94,8 94.1 94,9 ? ? ? ? 2 2 Average: Stdev: Coefficient of Variation Median: Mode: Range: Maximum: Minimum: ? ? ? . ? ? ? 2 ? ? Question 1 Question 2 Question 3 Years Apple Samsung 2020 -150 -150 Assume that you are planning to invest stocks and you want to decide which option is more profitable for you by applying NPV and IRR analysis. Write down which one is more profitable and why? (Discount Rate: 5%) 2021 2022 2023 2024 2025 2026 2027 2028 18 16 15 20 25 32 25 23 19 20 21 22 24 42 ? NPV at the beginning NPV at the end IRR Discount Rate 2 2 ? ? Question 1 Question 2 Question 3 Years 1989 1990 1991 1992 1993 Assets Current Assets Cash Accounts Receivable Inventories Other Current Assets 422 3626 5162 725 1481 3702 4460 877 1281 4783 4872 910 1247 6377 5983 988 Average 15322 7476? 6913? 10312 Total Current Assets ? ? ? ? ? Fixed Assets Plant&Equipment Accumulated Depreciation Other 5995 -5995 7545 6100 -6100 8170 7900 -7900 9834 10100 -10100 10034 134212 -13421 ? 15555 ? Total Fixed Assets ? ? ? ? ? ? Total Assets ? ? ? 2 ? 2 L&O/E Current Liabilities Accounts Payable Accrued Liabilities Notes Payable Short Term Debt 2890 842 4671 1538 3654 1020 560 880 3187 1234 0 1500 6200 18442 600? 212? 640 1031 378 Total Current Liabilities ? ? ? 2 ? ? 0 Long Term Debt Notes Payable Bonds Bank Debt 640 2010 0 0 2500 0 2500 0 1200 2500) 0 600 ? 4000? 800? Total Long Term Debt ? ? ? ? 2 Other Liabilities Deferred Income Tax 250 150 243 231 307? Total Liabilities ? ? ? 2 ? ? Equity Common Stock Capital Surplus Retained Earings 1200 2150 5126 1200 2150 7287 1200 2150 9666 1200 2150 12161 1200 2150? 145942 Total Equity ? ? 2 ? ? Total Liabilities & O/E ? ? ? ? ? ? Question 1 Question 2 Question 3 Dell *Which company seems more profitable and which one seems riskier? Why? Explain. Answer: Date 04.06.2011 07.06.2011 08.06.2011 09.06.2011 10.06.2011 11.06.2011 14.06.2011 15.06.2011 16.06.2011 17.06.2011 18.06.2011 21.06.2011 22.06.2011 23.06.2011 24.06.2011 25.06.2011 Toshiba 112,9 112,8 113,2 113,1 113,2 113.2 113,4 113,5 114,5 114,6 114,5 115,1 115,0 115,3 115,1 116,2 93,8 94,2 94,1 94,1 94,2 94,5 92,5 93,6 94,1 94,6 94,7 94,1 94,5 94,8 94.1 94,9 ? ? ? ? 2 2 Average: Stdev: Coefficient of Variation Median: Mode: Range: Maximum: Minimum: ? ? ? . ? ? ? 2 ? ? Question 1 Question 2 Question 3 Years Apple Samsung 2020 -150 -150 Assume that you are planning to invest stocks and you want to decide which option is more profitable for you by applying NPV and IRR analysis. Write down which one is more profitable and why? (Discount Rate: 5%) 2021 2022 2023 2024 2025 2026 2027 2028 18 16 15 20 25 32 25 23 19 20 21 22 24 42 ? NPV at the beginning NPV at the end IRR Discount Rate 2 2
Step by Step Solution
There are 3 Steps involved in it

Get step-by-step solutions from verified subject matter experts