

Question: Question #1 (Using average and standard deviation of annual returns, 15 points): Fill in your answers in the blanks for each of the empty yellow
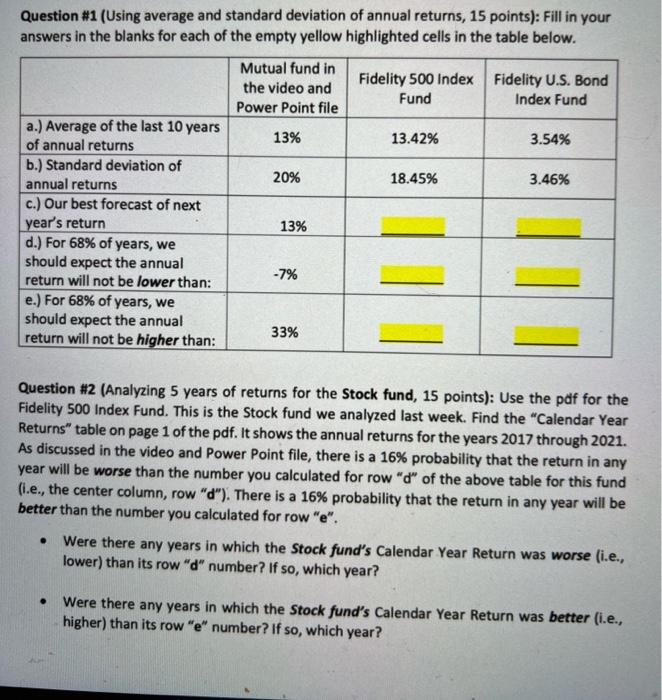
Question #1 (Using average and standard deviation of annual returns, 15 points): Fill in your answers in the blanks for each of the empty yellow highlighted cells in the table below. Mutual fund in the video and Power Point file Fidelity 500 Index Fidelity U.S. Bond Fund Index Fund 13% 13.42% 3.54% 20% 18.45% 3.46% a.) Average of the last 10 years of annual returns b.) Standard deviation of annual returns c.) Our best forecast of next year's return d.) For 68% of years, we should expect the annual return will not be lower than: e.) For 68% of years, we should expect the annual return will not be higher than: 13% -7% 33% Question #2 (Analyzing 5 years of returns for the Stock fund, 15 points): Use the pdf for the Fidelity 500 Index Fund. This is the Stock fund we analyzed last week. Find the "Calendar Year Returns" table on page 1 of the pdf. It shows the annual returns for the years 2017 through 2021. As discussed in the video and Power Point file, there is a 16% probability that the return in any year will be worse than the number you calculated for row "d" of the above table for this fund (i.e., the center column, row "d"). There is a 16% probability that the return in any year will be better than the number you calculated for row "e". Were there any years in which the Stock fund's Calendar Year Return was worse (i.e., lower) than its row "d" number? If so, which year? . Were there any years in which the Stock fund's Calendar Year Return was better (i.e., higher) than its row "e" number? If so, which year? Question #1 (Using average and standard deviation of annual returns, 15 points): Fill in your answers in the blanks for each of the empty yellow highlighted cells in the table below. Mutual fund in the video and Power Point file Fidelity 500 Index Fidelity U.S. Bond Fund Index Fund 13% 13.42% 3.54% 20% 18.45% 3.46% a.) Average of the last 10 years of annual returns b.) Standard deviation of annual returns c.) Our best forecast of next year's return d.) For 68% of years, we should expect the annual return will not be lower than: e.) For 68% of years, we should expect the annual return will not be higher than: 13% -7% 33% Question #2 (Analyzing 5 years of returns for the Stock fund, 15 points): Use the pdf for the Fidelity 500 Index Fund. This is the Stock fund we analyzed last week. Find the "Calendar Year Returns" table on page 1 of the pdf. It shows the annual returns for the years 2017 through 2021. As discussed in the video and Power Point file, there is a 16% probability that the return in any year will be worse than the number you calculated for row "d" of the above table for this fund (i.e., the center column, row "d"). There is a 16% probability that the return in any year will be better than the number you calculated for row "e". Were there any years in which the Stock fund's Calendar Year Return was worse (i.e., lower) than its row "d" number? If so, which year? . Were there any years in which the Stock fund's Calendar Year Return was better (i.e., higher) than its row "e" number? If so, which year
Step by Step Solution
There are 3 Steps involved in it

Get step-by-step solutions from verified subject matter experts