

Question: Question 1: Using the comparative financial information given, identify THREE specific account-related misstatement risks. For each risk, briefly describe why it qualifies as a risk
Question 1: Using the comparative financial information given, identify THREE specific account-related misstatement risks. For each risk, briefly describe why it qualifies as a risk and the related accounts and assertions that potentially may be violated.
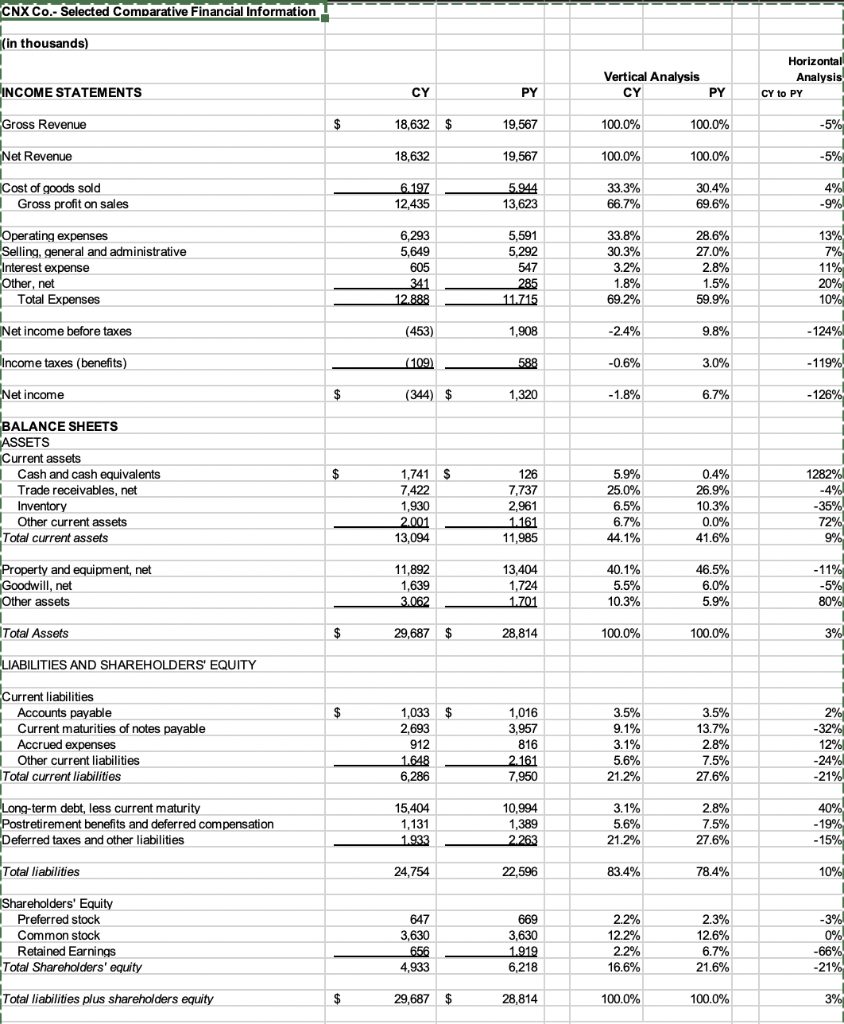
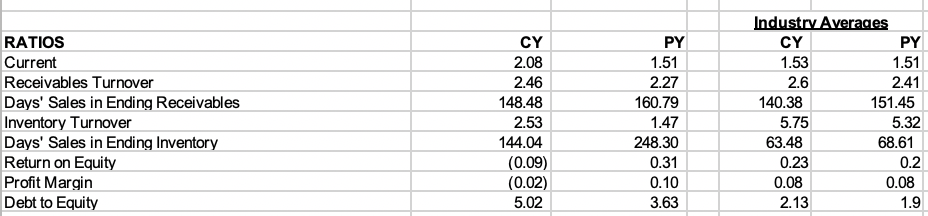
CNX Co.- Selected Comparative Financial Information (in thousands) Horizonta Vertical Analysis Analysis PY 100.0% 100.0% CY to PY PY 19,567 19,567 INCOME STATEMENTS 100.0% 100.0% 33.3% 18,632 $ ross Revenue Net Revenue Cost of goods sold 18,632 304% 695% 667% 33.8% 32% 692% 24% -0.6% 12,435 13,623 Gross profit on sales 6,293 5,649 605 5,591 5,292 28.6% 270% 28% Operating expenses ling, general and administrative nterest expense net 599% Total Expenses Net income before taxes ncome taxes (benefits) 453) 1,908 9,8% -124%) 3.0% -126%, 344 et income BALANCE SHEETS Current assets 1282%) 4 1,741 7,422 1,930 0.4% 26.9% 10.3% 00% Cash and cash equivalents Trade receivables, net 55% 250% 7,737 2,961 11,985 13,404 Other current assets 13,094 Total current assets -11% 465% 55% 100.0% 11,892 1,639 ty and equipment, neft 1,724 10.3% Other assets Total Assets LIABILITIES AND SHAREHOLDERS' EQUITY 29,687 $ 28,814 1000% 3.5% 13.7% 28% urrent liabilities 1,016 3,957 1,033 $ Accounts payable Current maturities of notes payable Accrued expenses Other current liabilities 12%) 24%) 21 912 6,286 5,404 5.6% 21.2% 7,950 278% Total current liabilities 2.8% 15% 275% 10,994 Long-term debt, less current maturity tretirement benefits and deferred compensation eferred taxes and other liabilities 1,131 56% 21.2% -15 10%) 24,754 22,596 Total liabilities Shareholders' Equity 23% 12.6% 67% 21.6% 669 Preferred stock Common stock Retained Earnings 3,630 4,933 29,687 $ 3,630 6,218 28,814 12.2% 16.6% 100.0% 21 Total Shareholders' equity 100.0% Total liabilities plus shareholders equity RATIOS Current Receivables Turnover Days' Sales in Ending Receivables Inventory Turnover Days' Sales in Ending Inventory Return on Equity Profit Margin Debt to Equity CY 2.08 2.46 148.48 2.53 144.04 (0.09) 0.02) 5.02 PY 1.51 2.27 160.79 1.47 248.30 0.31 0.10 3.63 CY 1.53 2.6 140.38 5.75 63.48 0.23 0.08 2.13 PY 1.51 2.41 151.45 5.32 68.61 0.2 0.08 CNX Co.- Selected Comparative Financial Information (in thousands) Horizonta Vertical Analysis Analysis PY 100.0% 100.0% CY to PY PY 19,567 19,567 INCOME STATEMENTS 100.0% 100.0% 33.3% 18,632 $ ross Revenue Net Revenue Cost of goods sold 18,632 304% 695% 667% 33.8% 32% 692% 24% -0.6% 12,435 13,623 Gross profit on sales 6,293 5,649 605 5,591 5,292 28.6% 270% 28% Operating expenses ling, general and administrative nterest expense net 599% Total Expenses Net income before taxes ncome taxes (benefits) 453) 1,908 9,8% -124%) 3.0% -126%, 344 et income BALANCE SHEETS Current assets 1282%) 4 1,741 7,422 1,930 0.4% 26.9% 10.3% 00% Cash and cash equivalents Trade receivables, net 55% 250% 7,737 2,961 11,985 13,404 Other current assets 13,094 Total current assets -11% 465% 55% 100.0% 11,892 1,639 ty and equipment, neft 1,724 10.3% Other assets Total Assets LIABILITIES AND SHAREHOLDERS' EQUITY 29,687 $ 28,814 1000% 3.5% 13.7% 28% urrent liabilities 1,016 3,957 1,033 $ Accounts payable Current maturities of notes payable Accrued expenses Other current liabilities 12%) 24%) 21 912 6,286 5,404 5.6% 21.2% 7,950 278% Total current liabilities 2.8% 15% 275% 10,994 Long-term debt, less current maturity tretirement benefits and deferred compensation eferred taxes and other liabilities 1,131 56% 21.2% -15 10%) 24,754 22,596 Total liabilities Shareholders' Equity 23% 12.6% 67% 21.6% 669 Preferred stock Common stock Retained Earnings 3,630 4,933 29,687 $ 3,630 6,218 28,814 12.2% 16.6% 100.0% 21 Total Shareholders' equity 100.0% Total liabilities plus shareholders equity RATIOS Current Receivables Turnover Days' Sales in Ending Receivables Inventory Turnover Days' Sales in Ending Inventory Return on Equity Profit Margin Debt to Equity CY 2.08 2.46 148.48 2.53 144.04 (0.09) 0.02) 5.02 PY 1.51 2.27 160.79 1.47 248.30 0.31 0.10 3.63 CY 1.53 2.6 140.38 5.75 63.48 0.23 0.08 2.13 PY 1.51 2.41 151.45 5.32 68.61 0.2 0.08
Step by Step Solution
There are 3 Steps involved in it

Get step-by-step solutions from verified subject matter experts