

Question: Question 10 (9 pts) The boxplots below represent three distinct data sets with the same number of elements. Each boxplot was plotted against the same
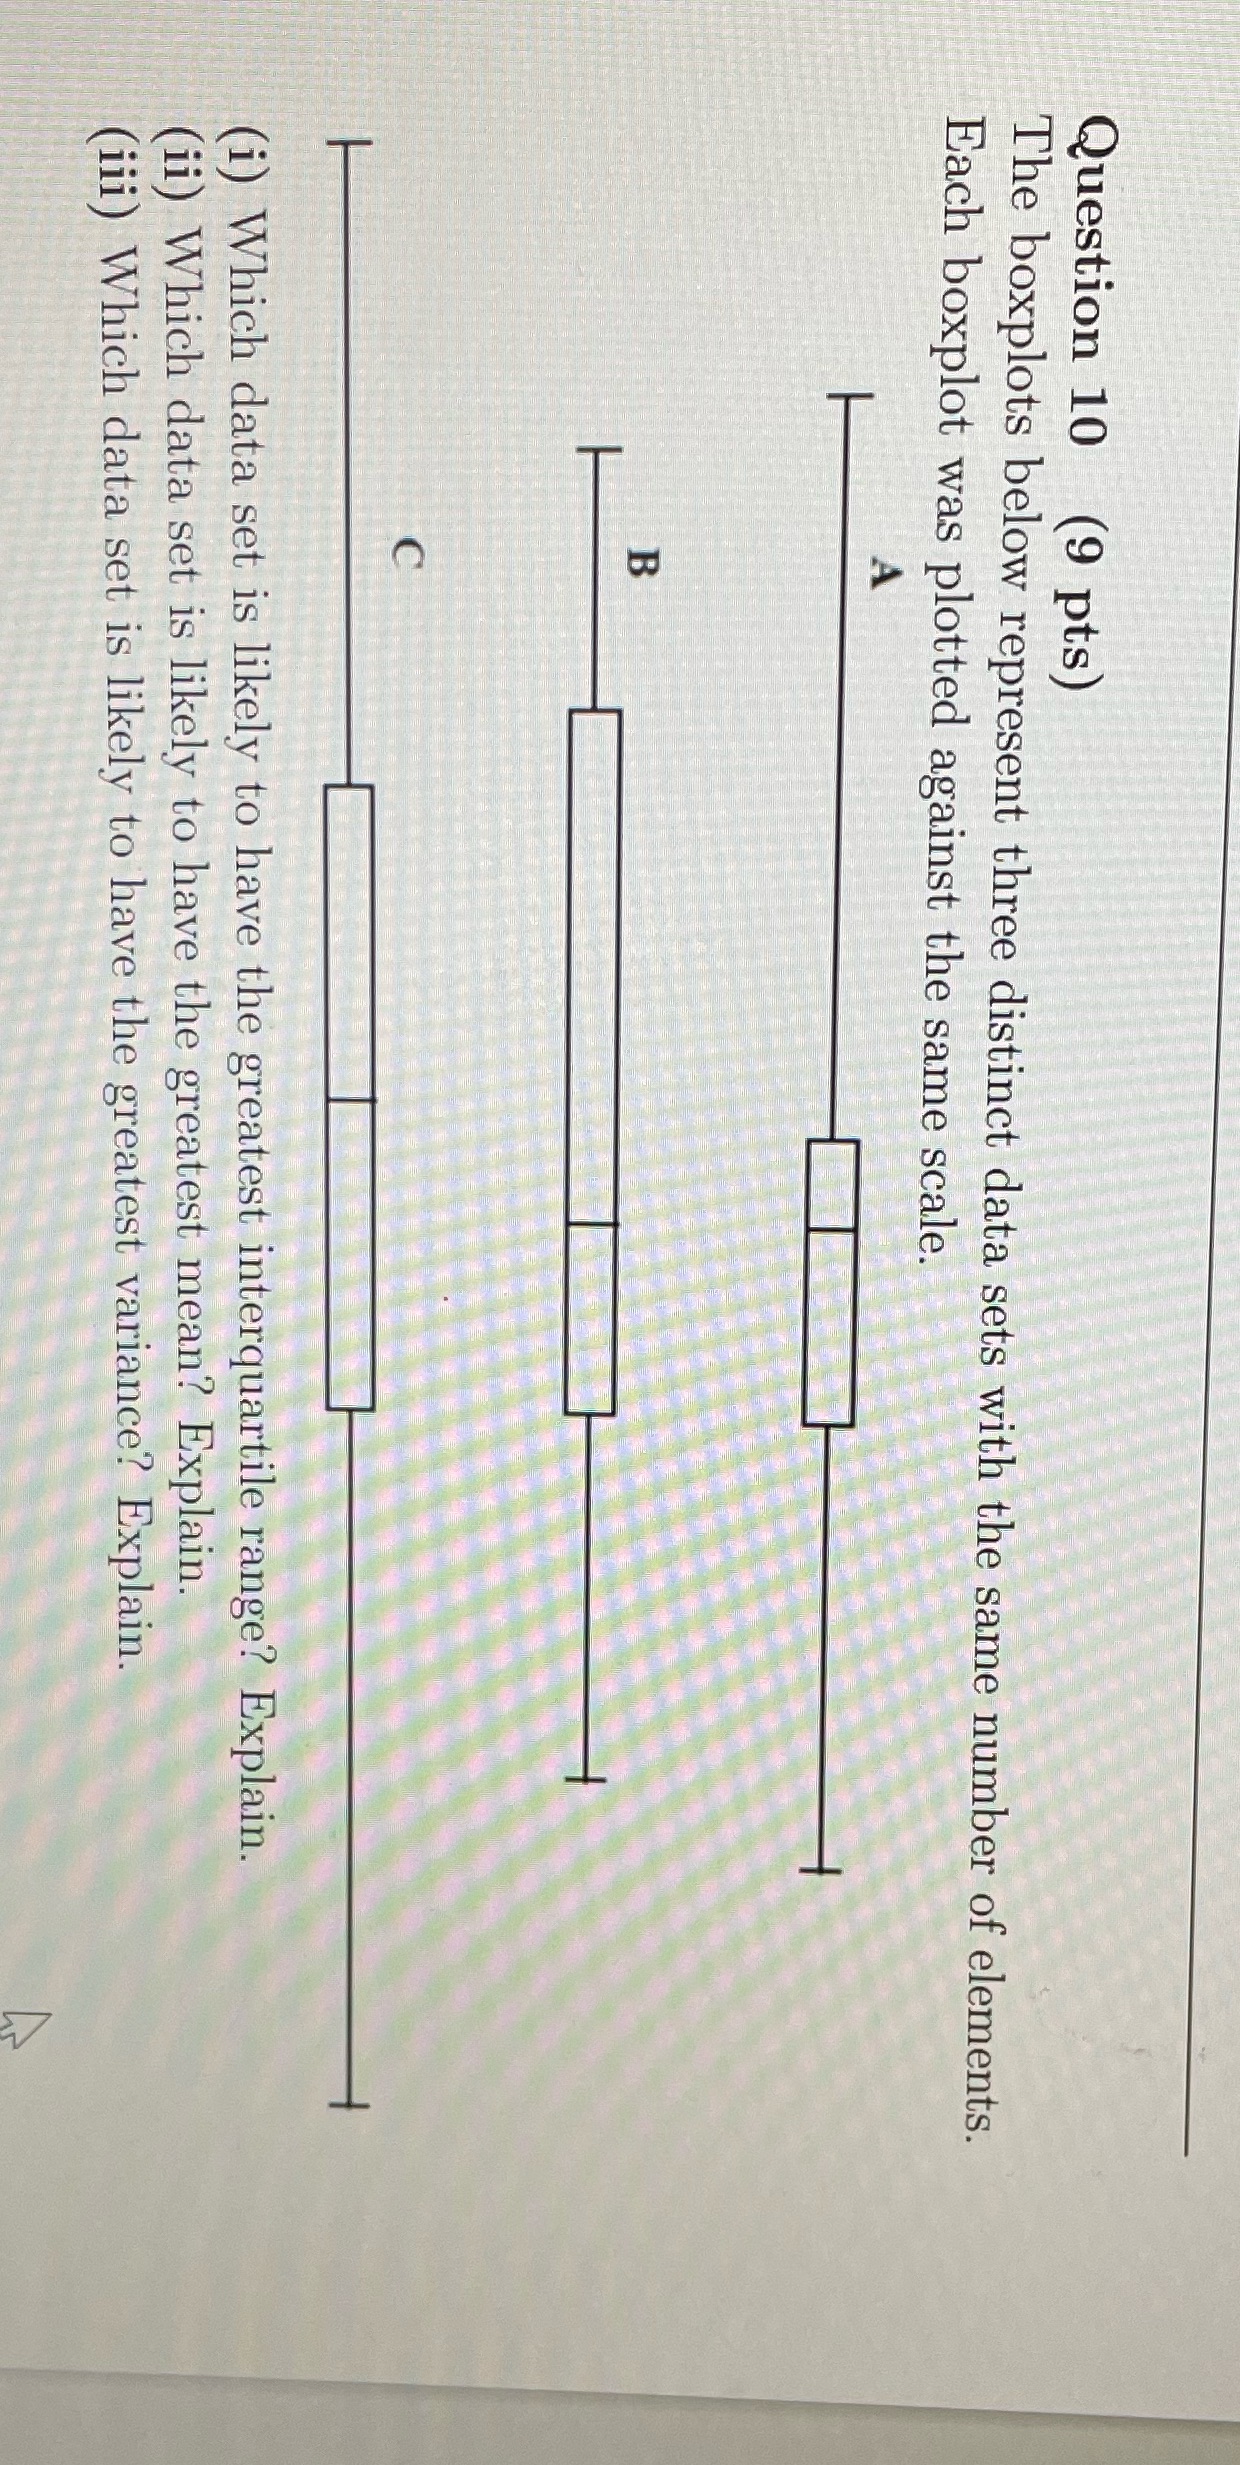
Question 10 (9 pts) The boxplots below represent three distinct data sets with the same number of elements. Each boxplot was plotted against the same scale. (i) Which data set is likely to have the greatest interquartile range? Explain. (ii) Which data set is likely to have the greatest mean? Explain. (iii) Which data set is likely to have the greatest variance? Explain
Step by Step Solution
There are 3 Steps involved in it
1 Expert Approved Answer
Step: 1 Unlock

Question Has Been Solved by an Expert!
Get step-by-step solutions from verified subject matter experts
Step: 2 Unlock
Step: 3 Unlock