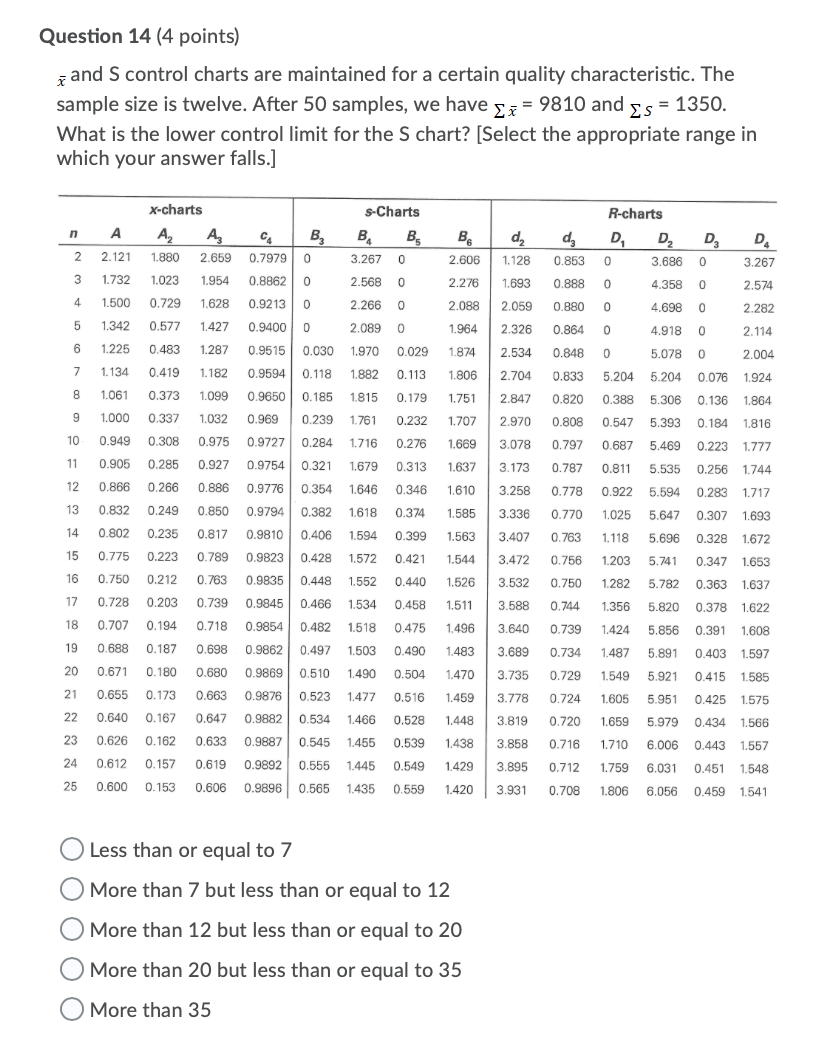
Question: Question 14 (4 points) qand S control charts are maintained for a certain quality characteristic. The sample size is twelve. After 50 samples, we have

Question 14 (4 points) qand S control charts areQuestion 14 (4 points) qand S control charts are

Question 14 (4 points) qand S control charts are maintained for a certain quality characteristic. The sample size is twelve. After 50 samples, we have [x = 9810 and Is = 1350. What is the lower control limit for the S chart? [Select the appropriate range in which your answer falls.] x-charts s-Charts n A . A 1.880 . 2.659 C4 0.7979 . 0 B 0 2.606 d 2 1.128 dz 0.853 R-charts D. D 3.686 D 0 De 3.267 2 2.121 3.267 0 3 1.732 1.023 1.954 0.8862 0 2.568 0 2.276 1.693 0.888 0 4.358 0 2.574 4 1.500 0.729 1.628 2.266 0 2.088 2.059 0.880 0 4.698 0 2.282 0.92130 0.9400 0 5 1.342 0.577 1.427 2.089 0 1.964 2.326 0.864 0 4.918 0 2.114 6 1.225 1.287 0.9515 0.030 1.970 0.029 1.874 2.534 0.848 0 5.078 0 2.004 0.483 0.419 7 1.134 1.182 1.882 0.113 1.806 2.704 0.833 5.204 5.204 0.076 1.924 0.9594 0.118 0.9650 0.185 8 1.061 0.373 1.099 1.815 0.179 1.751 2.847 0.820 0.388 5.306 0.136 1.864 9 1.000 0.337 1.032 0.969 0.239 1.761 0.232 1.707 2.970 0.808 0.547 5.393 0.184 1.816 10 0.308 0.9727 0.284 1.716 1.669 3.078 0.797 0.687 5.469 0.949 0.905 0.975 0.927 0.223 1.777 0.276 0.313 11 0.285 0.9754 0.321 1.679 1.637 3.173 0.787 0.811 5.535 0.256 1.744 12 0.866 0.266 0.886 1.646 0.346 1.610 3.258 0.778 0.922 5.594 0.283 1.717 0.9776 0.354 0.9794 0.382 13 0.832 0.249 0.850 1.618 0.374 1.585 3.336 0.770 1.025 5.647 0.307 1.693 14 0.802 0.235 0.817 0.9810 0.406 1.594 0.399 1.563 3.407 0.763 1.118 5.696 0.328 1.672 15 0.775 0.223 0.789 0.9823 0.428 1.572 0.421 1.544 3.472 0.756 1.203 5.741 0.347 1.653 16 0.750 0.212 0.763 0.9835 0.448 1.552 0.440 1.526 3.532 0.750 1.282 5.782 0.363 1.637 17 0.728 0.203 0.739 0.9845 0.466 1.534 0.458 1.511 3.588 0.744 1.356 5.820 0.378 1.622 18 0.194 0.718 1.518 0.707 0.688 0.475 1,496 3.640 0.739 1.424 5.856 19 0.391 1.608 0.403 1.597 0.187 0.698 1.503 0.490 1.483 3.689 0.734 1.487 5.891 0.9854 0.482 0.9862 0.497 0.9869 0.510 0.9876 0.523 20 0.671 0.180 0.680 1.490 0.504 1.470 3.735 0.729 1.549 5.921 0.415 1.585 21 0.655 0.173 1.477 0.516 1.459 3.778 0.724 1.605 5.951 0.425 1.575 0.663 0.647 22 0.640 0.167 0.9882 0.534 1.466 1.448 3.819 0.720 1.659 5.979 0.434 1.566 0.528 0.539 23 0.626 0.633 0.9887 1.438 3.858 0.716 1.710 6.006 0.545 1.455 0.555 1.445 0.162 0.157 0.153 0.443 1.557 0.451 1.548 24 0.612 0.9892 0.549 1.429 3.895 0.712 1.759 6.031 0.619 0.606 25 0.600 0.9896 0.565 1.435 0.559 1.420 3.931 0.708 1.806 6.056 0.459 1.541 Less than or equal to 7 More than 7 but less than or equal to 12 More than 12 but less than or equal to 20 More than 20 but less than or equal to 35 a More than 35 Question 15 (4 points) Polaris manufactures a part (Part #5621) of the powertrain in two locations. Random samples were taken from these locations to monitor quality level as follows. What is the average defects per million opportunities (dpmo) for Part #5621? Please take up to seven decimal point in your calculations. [Select the appropriate range in which your answer falls.] Locations Sample size Number of nonconforming parts found 10 3 Osceola, WI Roseau, MN 252 367 Less than or equal to 18,000 More than 18,000 but less than or equal to 24,000 More than 24,000 but less than or equal to 28,000 More than 28,000 but less than or equal to 32,000 More than 32000

Step by Step Solution

There are 3 Steps involved in it

1 Expert Approved Answer
Step: 1 Unlock blur-text-image
Question Has Been Solved by an Expert!

Get step-by-step solutions from verified subject matter experts

Step: 2 Unlock
Step: 3 Unlock

Students Have Also Explored These Related General Management Questions!