

Question: x and S control charts are maintained for a certain quality characteristic. The sample size is twelve. After 50 samples, we have x=9810 and s=1350.
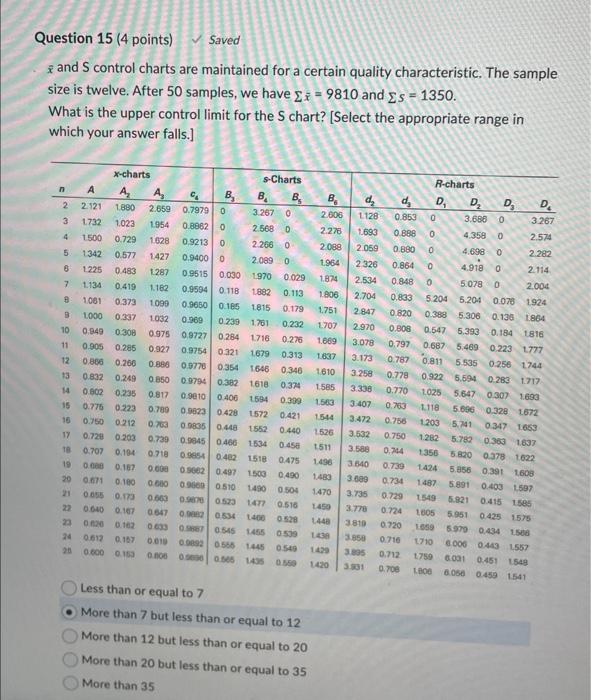
x and S control charts are maintained for a certain quality characteristic. The sample size is twelve. After 50 samples, we have x=9810 and s=1350. What is the upper control limit for the S chart? [Select the appropriate range in which your answer falls.] Less than or equal to 7 More than 7 but less than or equal to 12
Step by Step Solution
There are 3 Steps involved in it
1 Expert Approved Answer
Step: 1 Unlock

Question Has Been Solved by an Expert!
Get step-by-step solutions from verified subject matter experts
Step: 2 Unlock
Step: 3 Unlock