

Question: x and S control charts are maintained for a certain quality characteristic. The sample size is twelve. After 50 samples, we have x=9810 and s=1350.
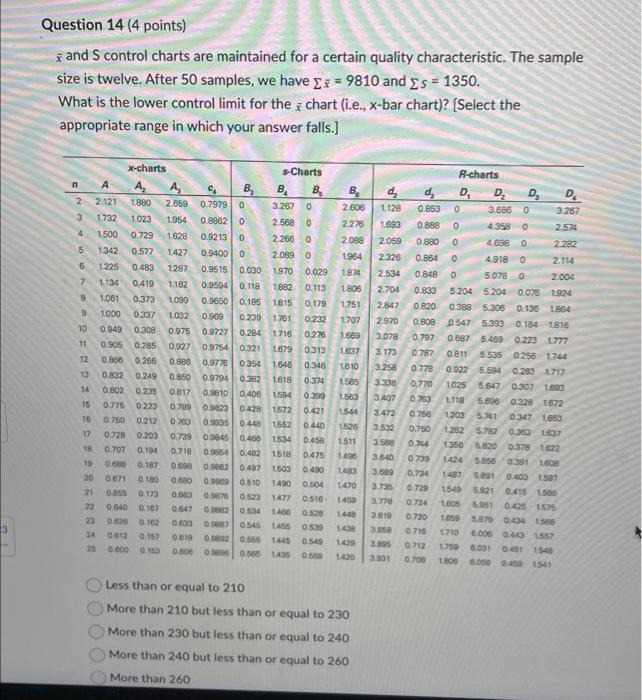
x and S control charts are maintained for a certain quality characteristic. The sample size is twelve. After 50 samples, we have x=9810 and s=1350. What is the lower control limit for the x chart (i.e., x-bar chart)? [Select the appropriate range in which your answer falls.] Less than or equal to 210 More than 210 but less than or equal to 230 More than 230 but less than or equal to 240 More than 240 but less than or equal to 260
Step by Step Solution
There are 3 Steps involved in it
1 Expert Approved Answer
Step: 1 Unlock

Question Has Been Solved by an Expert!
Get step-by-step solutions from verified subject matter experts
Step: 2 Unlock
Step: 3 Unlock