

Question: Question 15. 3-2-77 Polnts:0of1' A driver has something to do with his or her chance of getting into a fatal car crash. The bar Age
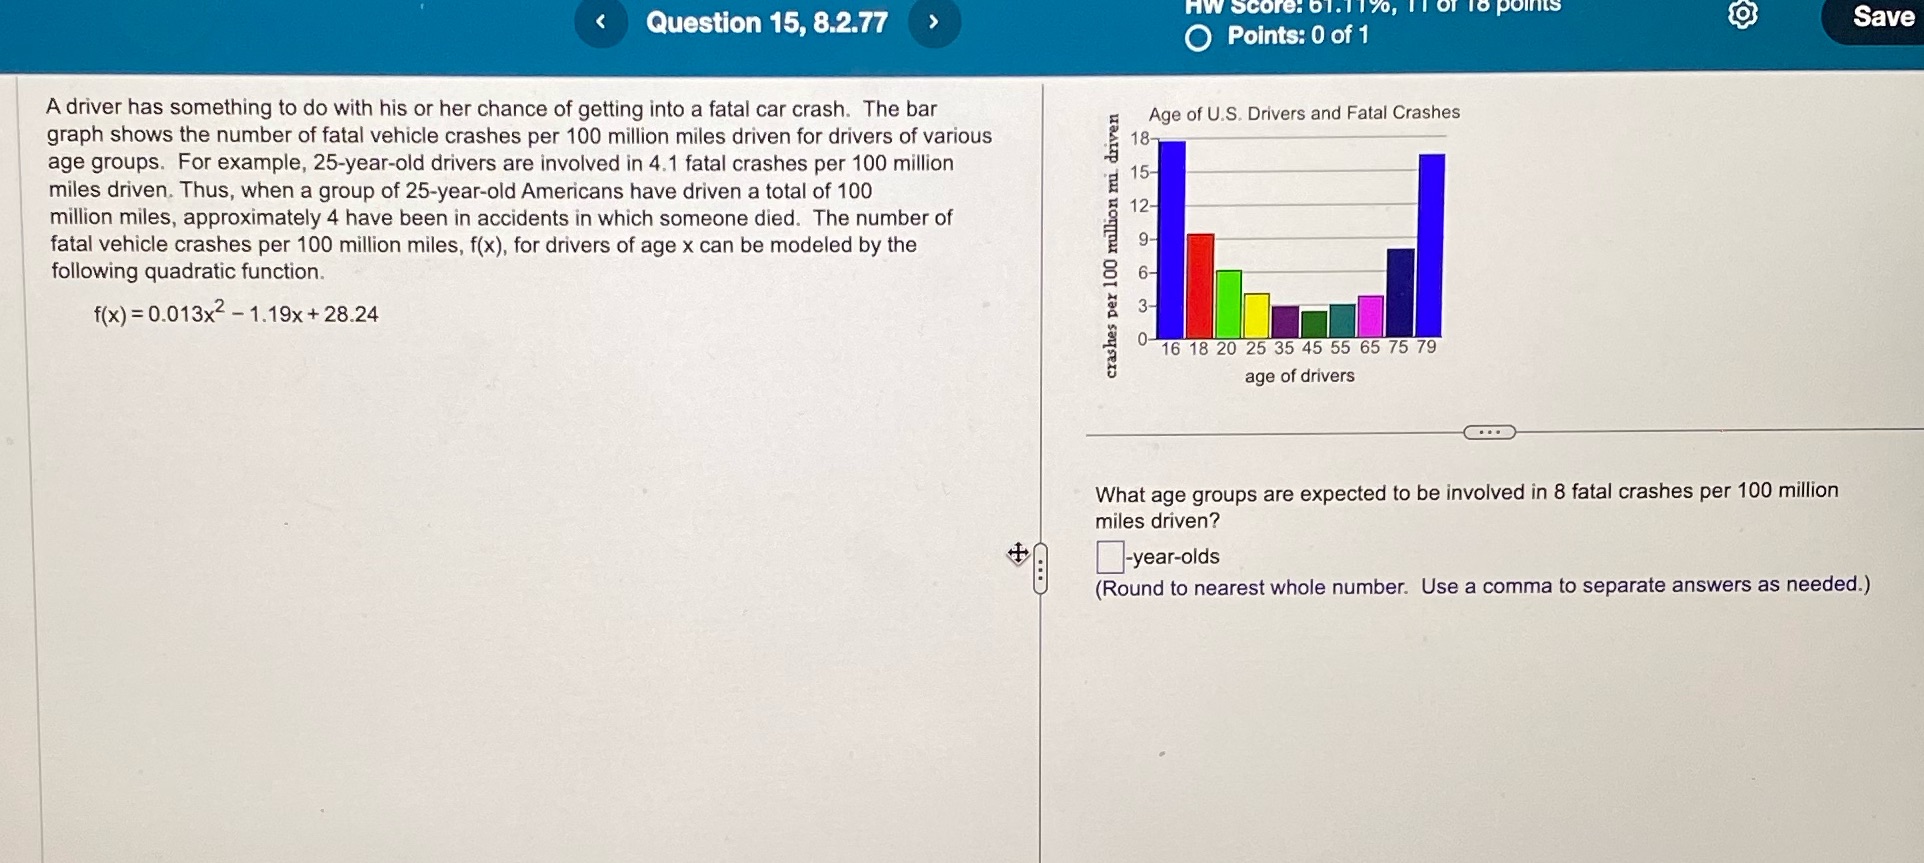
Question 15. 3-2-77 Polnts:0of1' A driver has something to do with his or her chance of getting into a fatal car crash. The bar Age 0, U 3 Drwers and Fatal Crashes graph shows the number of fatal vehicle crashes per 100 million miles driven for drivers of various E '18 age groups For example, 25year-old drivers are involved in 4)1 fatal crashes per 100 million '5 15 miles driven. Thus, when a group of 25year-old Americans have driven a total of 100 E 12 million miles, approximately 4 have been in accidents In which someone died, The number of % fatal vehicle crashes per 100 million miles, for), for drivers of age x can be modeled by the 9 following quadratic function. E 6 N f(x)=0.013x2 'l.19x+28.24 3 '5 0161820 25354555 6575 79 age of drivers (3- What age groups are expected to be involved in 8 fatal crashes per 100 million miles driven? D-yearolds (Round to nearest whole numben Use a comma to separate answers as needed.) f\
Step by Step Solution
There are 3 Steps involved in it

Get step-by-step solutions from verified subject matter experts