

Question: Question 18 0.5 Questions 18 - 24 are based on the same information below. The following graphs are derived using CAPM method based on price
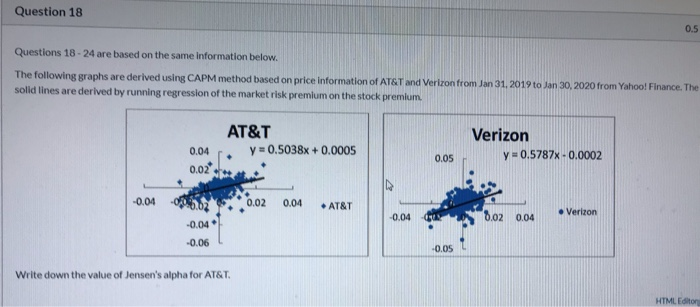


Question 18 0.5 Questions 18 - 24 are based on the same information below. The following graphs are derived using CAPM method based on price information of AT&T and Verizon from Jan 31, 2019 to Jan 30, 2020 from Yahoo! Finance. The solid lines are derived by running regression of the market risk premium on the stock premium. AT&T y = 0.5038x + 0.0005 Verizon y=0.5787x -0.0002 0.04 0.05 0.02 -0.04 0.02 0.04 AT&T -0.04 8.02 0.04 Verizon -0.04 -0.06 -0.05 Write down the value of Jensen's alpha for AT&T HTML Editor Question 19 Based on the information of Question 18, write down the value of historical (raw) beta for AT&T. Question 20 Based on the information of Question 18, is AT&T alone a good investment? D Question 21 Based on the information of Question 18, write down the value of Jensen's alpha for Verizon Question 22 Based on the Information of Question 18, write down the value of historical (raw) beta for Verizon. Question 23 Based on the Information of Question 18, Is Verizon alone a good investment? Based on the information of Question 18, use market neutral and pair trading strategy, and the two stocks alpha and raw beta values, decide how to allocate your wealth on these two stocks to achieve a successful market neutral portfolio Please show all your work Question 18 0.5 Questions 18 - 24 are based on the same information below. The following graphs are derived using CAPM method based on price information of AT&T and Verizon from Jan 31, 2019 to Jan 30, 2020 from Yahoo! Finance. The solid lines are derived by running regression of the market risk premium on the stock premium. AT&T y = 0.5038x + 0.0005 Verizon y=0.5787x -0.0002 0.04 0.05 0.02 -0.04 0.02 0.04 AT&T -0.04 8.02 0.04 Verizon -0.04 -0.06 -0.05 Write down the value of Jensen's alpha for AT&T HTML Editor Question 19 Based on the information of Question 18, write down the value of historical (raw) beta for AT&T. Question 20 Based on the information of Question 18, is AT&T alone a good investment? D Question 21 Based on the information of Question 18, write down the value of Jensen's alpha for Verizon Question 22 Based on the Information of Question 18, write down the value of historical (raw) beta for Verizon. Question 23 Based on the Information of Question 18, Is Verizon alone a good investment? Based on the information of Question 18, use market neutral and pair trading strategy, and the two stocks alpha and raw beta values, decide how to allocate your wealth on these two stocks to achieve a successful market neutral portfolio Please show all your work
Step by Step Solution
There are 3 Steps involved in it

Get step-by-step solutions from verified subject matter experts