

Question: Questions 18 - 24 are based on the same information below. 18. The following graphs are derived using CAPM method based on price information of
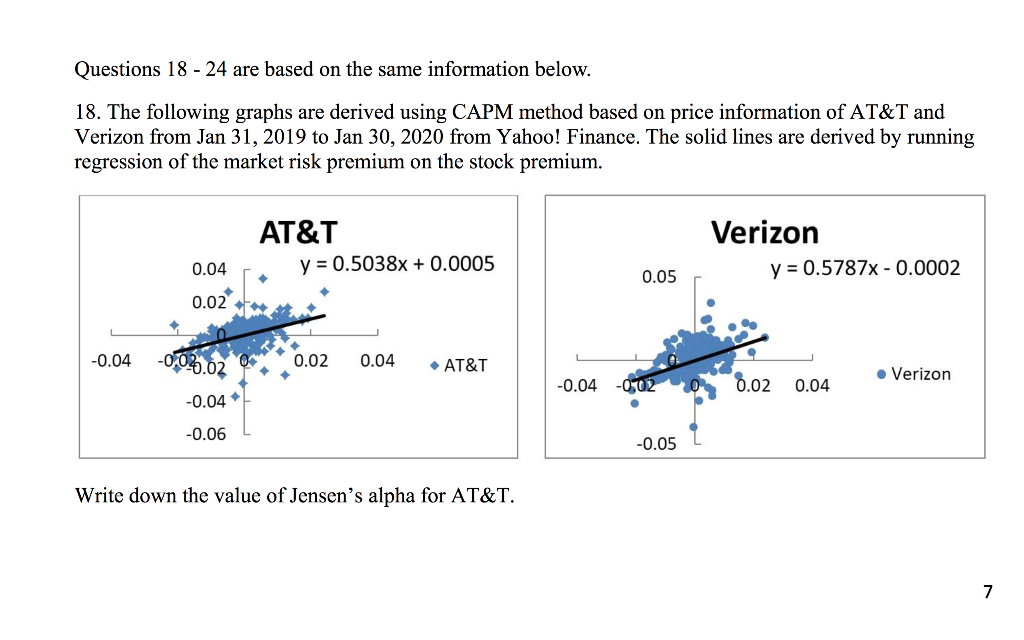
Questions 18 - 24 are based on the same information below. 18. The following graphs are derived using CAPM method based on price information of AT&T and Verizon from Jan 31, 2019 to Jan 30, 2020 from Yahoo! Finance. The solid lines are derived by running regression of the market risk premium on the stock premium. AT&T y = 0.5038x + 0.0005 Verizon y = 0.5787x -0.0002 0.04 0.05 0.02 -0.04 -0.02.02 0.02 0.04 AT&T Verizon -0.04 0.02 0.04 -0.04 -0.06 -0.05 Write down the value of Jensen's alpha for AT&T. 7
Step by Step Solution
There are 3 Steps involved in it
1 Expert Approved Answer
Step: 1 Unlock

Question Has Been Solved by an Expert!
Get step-by-step solutions from verified subject matter experts
Step: 2 Unlock
Step: 3 Unlock