

Question: QUESTION 19 In this graph, the area between points A, E, and O represents: D O O A. Operating income OB.Fixed costs oc. Breakeven point
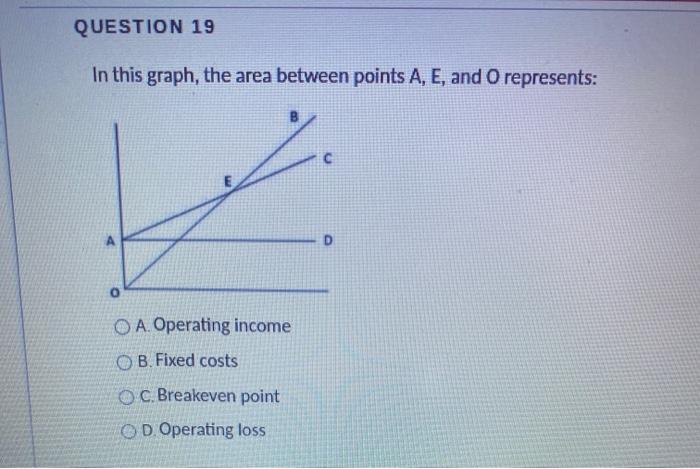
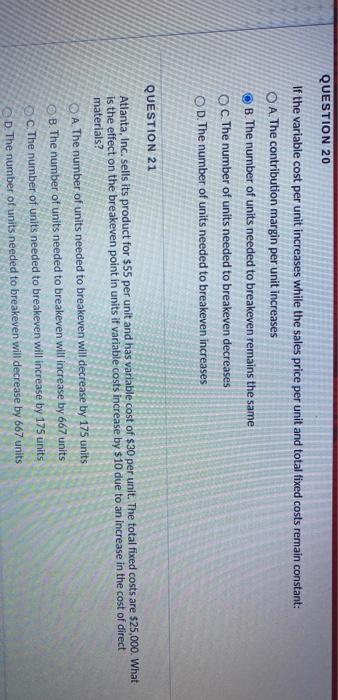
QUESTION 19 In this graph, the area between points A, E, and O represents: D O O A. Operating income OB.Fixed costs oc. Breakeven point OD Operating loss QUESTION 20 If the variable cost per unit increases while the sales price per unit and total fixed costs remain constant: O A. The contribution margin per unit increases B. The number of units needed to breakeven remains the same OC. The number of units needed to breakeven decreases OD. The number of units needed to breakeven increases QUESTION 21 Atlanta, Inc. sells its product for $55 per unit and has variable cost of $30 per unit. The total fixed costs are $25,000. What is the effect on the breakeven point in units if variable costs increase by $10 due to an increase in the cost of direct materials? O A The number of units needed to breakeven will decrease by 175 units B. The number of units needed to breakeven will increase by 667 units c. The number of units needed to breakeven will increase by 175 units D. The number of units needed to breakeven will decrease by 667 units
Step by Step Solution
There are 3 Steps involved in it

Get step-by-step solutions from verified subject matter experts