

Question: QUESTION 19 In this graph, the area between points B, E, and C represents: D O A. Operating loss O B.Breakeven point O C. Operating
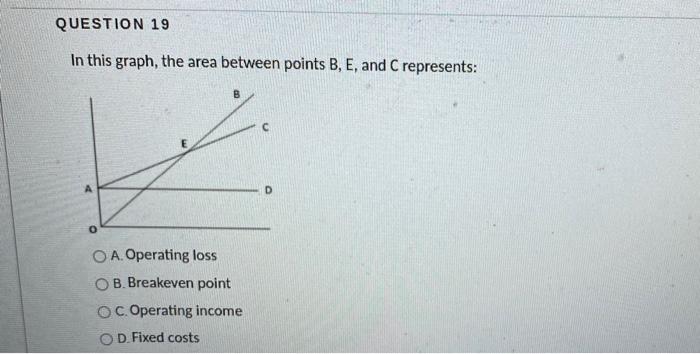
QUESTION 19 In this graph, the area between points B, E, and C represents: D O A. Operating loss O B.Breakeven point O C. Operating income OD Fixed costs
Step by Step Solution
There are 3 Steps involved in it
1 Expert Approved Answer
Step: 1 Unlock

Question Has Been Solved by an Expert!
Get step-by-step solutions from verified subject matter experts
Step: 2 Unlock
Step: 3 Unlock