

Question: In the graph below, the area between the lines AC and OB after point 'E' represents _ 11 ISLANDS SES a. fixed costs b. breakeven
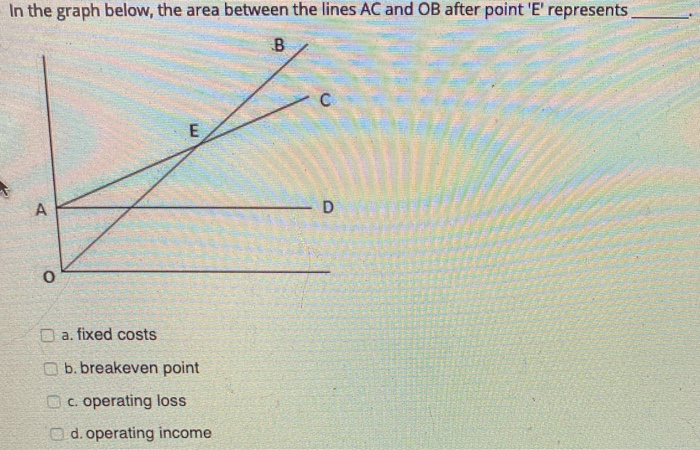
In the graph below, the area between the lines AC and OB after point 'E' represents _ 11 ISLANDS SES a. fixed costs b. breakeven point c. operating loss d. operating income
Step by Step Solution
There are 3 Steps involved in it
1 Expert Approved Answer
Step: 1 Unlock

Question Has Been Solved by an Expert!
Get step-by-step solutions from verified subject matter experts
Step: 2 Unlock
Step: 3 Unlock