

Question: Question 2 (1 point) Suppose you have N data points randomly distributed in a D-dimensional hypercube and your model relies on looking at k nearest
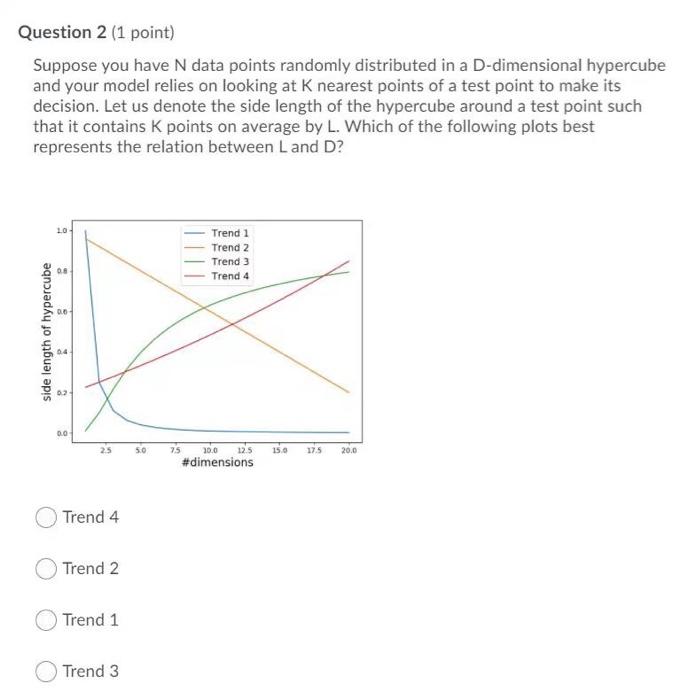
Question 2 (1 point) Suppose you have N data points randomly distributed in a D-dimensional hypercube and your model relies on looking at k nearest points of a test point to make its decision. Let us denote the side length of the hypercube around a test point such that it contains K points on average by L. Which of the following plots best represents the relation between Land D? 10 Trend 1 Trend 2 Trend 3 Trend 4 00 side length of hypercube 0.2 00 25 5.0 125 150 17.5 20.0 20.0 #dimensions Trend 4 Trend 2 Trend 1 Trend 3
Step by Step Solution
There are 3 Steps involved in it
1 Expert Approved Answer
Step: 1 Unlock

Question Has Been Solved by an Expert!
Get step-by-step solutions from verified subject matter experts
Step: 2 Unlock
Step: 3 Unlock