

Question: ) Question 2 2 pts We have a conference presentation and want to visually show the audience what the US. divorce rate since 1950. An
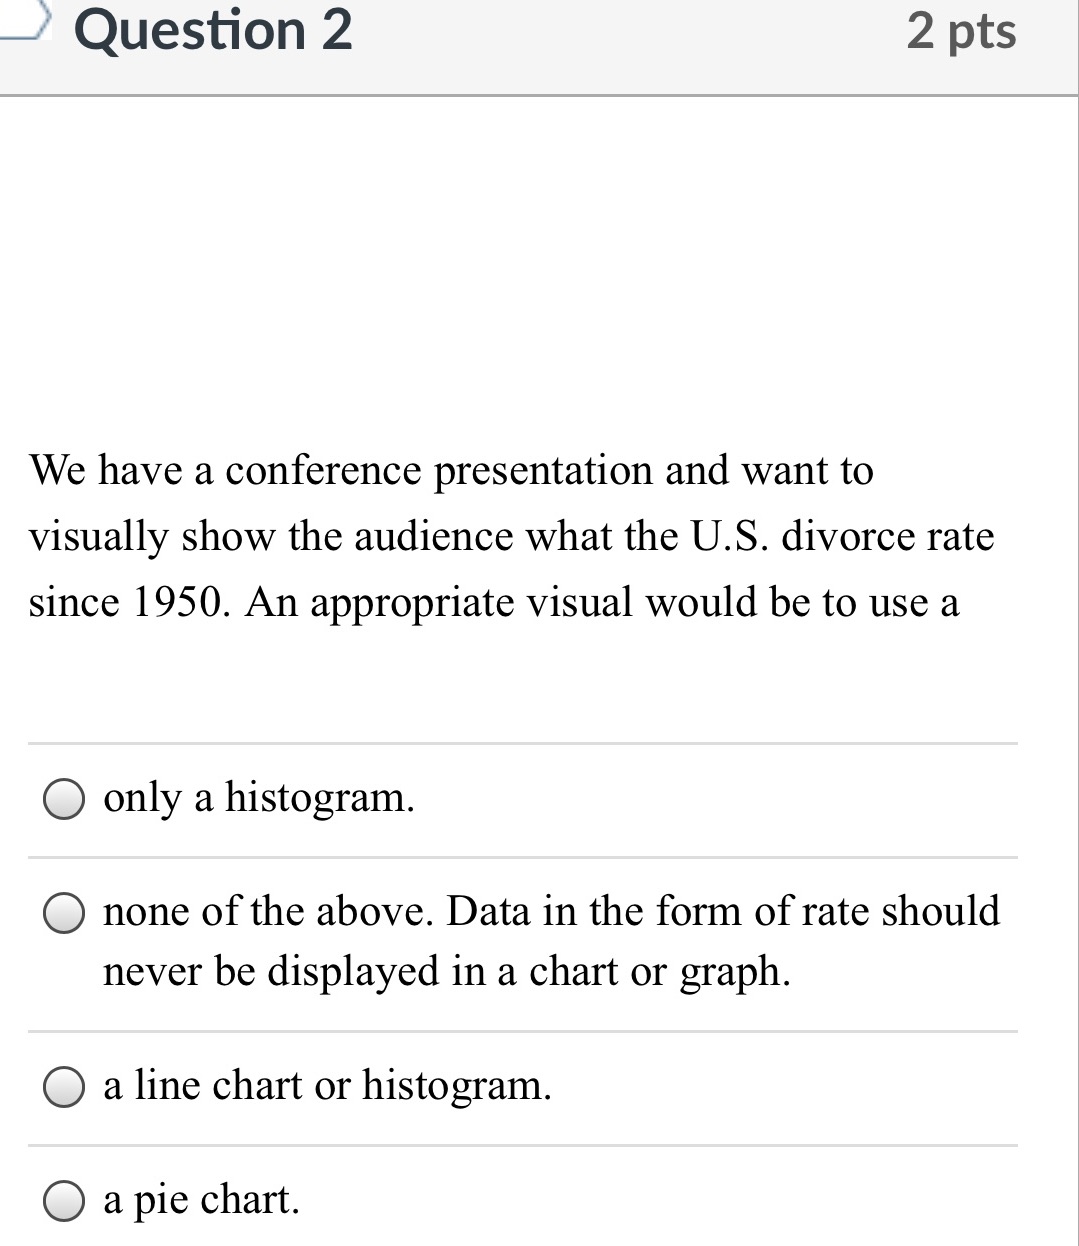
) Question 2 2 pts We have a conference presentation and want to visually show the audience what the US. divorce rate since 1950. An appropriate visual would be to use a O only a histogram. O none of the above. Data in the form of rate should never be displayed in a chart or graph. O a line chart or histogram. O a pie chart
Step by Step Solution
There are 3 Steps involved in it
1 Expert Approved Answer
Step: 1 Unlock

Question Has Been Solved by an Expert!
Get step-by-step solutions from verified subject matter experts
Step: 2 Unlock
Step: 3 Unlock