

Question: Question 2 A distillation column is to be designed to separate the binary mixtures (A and B) for System I using equilibrium curve diagram as
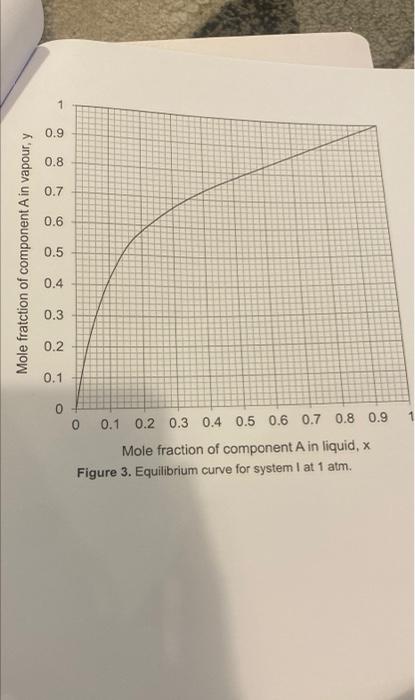
Question 2 A distillation column is to be designed to separate the binary mixtures (A and B) for System I using equilibrium curve diagram as shown in Figure 2. Using McCabe-Thiele graphical construction answer the following questions for each system a) Calculate the minimum reflux ratio (R.) to affect the separation b) Calculate reflux ratio (R) WR is 15 x R. c) Determine the number of equilibrium stages for reflux ratio (R) in part b). d) Determine the feed location for reflux ratio (R) in part b) e) Determine the number of equilibrium stages required at total reflux Calculate the molar flow rates (in kmoun) of distillate and bottoms. Data: Equilibrium curve diagram for System is given in Figure 2. . For system 1 (Figure 2), the following additional information is given Feed (F) = 100 kmol/l: 25% of feed is vapourised The composition of component A in Feed = 50% The composition of component A in Distillate = 96% minimum The composition of component A in Bottoms = 4% maximum Please Note: All percentages given in Question 2 are in mole basis. Page 6 of 10 0.9 0.8 0.7 0.6 Mole fratction of component A in vapour, y 0.5 0.4 0.3 0.2 0.1 0 1 0.1 0.2 0.3 0.4 0.5 0.6 0.7 0.8 0.9 Mole fraction of component A in liquid, X Figure 3. Equilibrium curve for system 1 at 1 atm
Step by Step Solution
There are 3 Steps involved in it

Get step-by-step solutions from verified subject matter experts